



By Matt Wampler, CEO of ClearCOGS
The answer, up front. USDA’s Economic Research Service updated its Food Price Outlook on October 23, 2026. For 2027, it forecasts restaurant menu prices (food away from home) to rise 2.8 percent, with a forecast interval of 0.7 to 5.0 percent. Grocery prices (food at home) are forecast to rise 1.0 percent, with an interval of minus 5.2 to plus 7.5 percent. Eggs carry the widest category interval, from minus 29.5 to plus 41.1 percent.
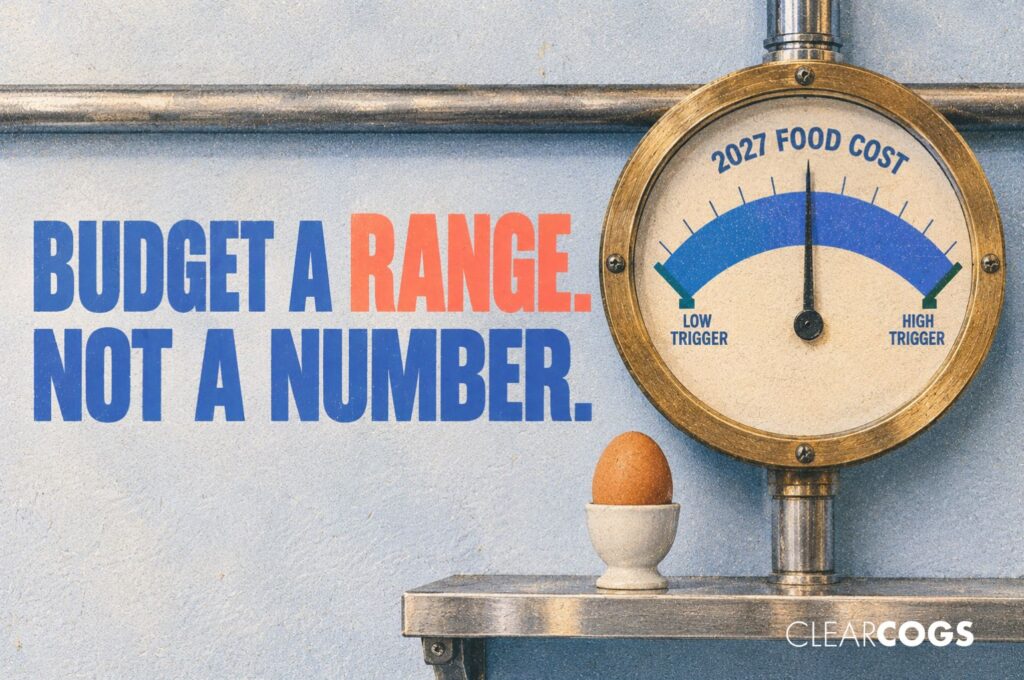
The budgeting advice that follows: write the 2027 food cost line as a range with a midpoint and two triggers, and build the ordering plan so it can move inside that range without a re-forecast.
Budget season is when a forecast turns into a promise. The finance team needs one food cost percentage for the board deck. The operations team has to hit that number with whatever eggs, oil and cheese actually cost in March. This post is written as the memo I would send to a CFO this week, with the operations side of the argument included, because both sides have a point.
MEMO
To: Chief Financial Officer
Cc: VP of Operations, Director of Purchasing
Re: How to set the 2027 food cost budget using USDA’s October outlook
Date: November 2026
What does USDA actually forecast for 2027 food prices?
The Food Price Outlook forecasts the change in calendar-year average prices, 2027 compared with 2026. It is based on statistical models fitted to recent trends, and USDA publishes a midpoint plus a forecast interval to show the level of uncertainty. The October edition is the one that matters this budget cycle because it incorporates the September Consumer Price Index and Producer Price Index data, and the next update lands on November 24, after many groups have locked their numbers.
Here are the 2027 figures that matter to a restaurant group, taken from the October 23 data file.
| Category (USDA CPI forecast, 2027 vs 2026) | Midpoint | Low end | High end | Width of range |
|---|---|---|---|---|
| Food away from home (menu prices) | 2.8% | 0.7% | 5.0% | 4.3 points |
| Food at home (grocery prices) | 1.0% | minus 5.2% | 7.5% | 12.7 points |
| Eggs | minus 0.8% | minus 29.5% | 41.1% | 70.6 points |
| Fats and oils | 1.9% | minus 9.5% | 15.2% | 24.7 points |
| Dairy products | minus 0.6% | minus 6.5% | 5.6% | 12.1 points |
| Nonalcoholic beverages (includes coffee) | 4.4% | minus 0.7% | 9.7% | 10.4 points |
| Fresh vegetables | minus 0.6% | minus 8.9% | 8.4% | 17.3 points |
| Poultry | 0.9% | minus 5.5% | 7.9% | 13.4 points |
| Beef and veal | 2.4% | minus 8.8% | 15.5% | 24.3 points |
| Cereals and bakery products | 0.7% | minus 5.8% | 7.5% | 13.3 points |
Source: USDA Economic Research Service, Food Price Outlook, Changes in Consumer Price Indexes 2024 through 2027, updated October 23, 2026. Annual average percent change, not seasonally adjusted. “Width of range” is the high end minus the low end, calculated by ClearCOGS.
Two things stand out. Of the three top-level lines (all food, food at home, food away from home), menu prices are the one whose whole range stays above zero. And the ingredient ranges are wide enough that the midpoint tells you the direction but says little about the size.
Why is a midpoint budget a problem for a multi-unit group?
A single-site owner can absorb a surprise on fryer oil with a quiet menu change. A 12-unit group cannot, because every category surprise is multiplied by 12 locations before anyone sees it on the P&L.
Here is a labeled hypothetical to show the size of the problem. Take a 12-unit group that spends $1,500 a month per location on fats and oils, which comes to $216,000 a year across the group. Apply USDA’s 2027 range for that category:
- Midpoint (1.9 percent): about $4,100 more than 2026.
- Low end (minus 9.5 percent): about $20,500 less than 2026.
- High end (15.2 percent): about $32,800 more than 2026.
The distance between the low and high outcomes is about $53,000 on one category. That is a real line item on a budget, and it is invisible if the budget only carries the 1.9 percent midpoint.
One caution on reading these figures. USDA’s categories are retail grocery indexes, which measure what consumers pay in a supermarket. They do not measure your distributor invoices. In my experience the direction tends to match over time, but the size of the move on your invoice can be different, which is a second reason to budget on a range rather than on a single point.
How do you set the number when the range is this wide?
There are three ways a group can set the 2027 food cost line. Each one has a cost.
| Option | What finance gets | What operations lives with |
|---|---|---|
| 1. Midpoint only | One clean number for the board. Easy to defend in November. | A target that USDA’s own interval says could miss by double digits on several categories. In a high-range year, ops is “over budget” for reasons it did not control. |
| 2. High end only | A safe number that is unlikely to be beaten by costs. | A budget that quietly tells managers to accept higher cost. Ordering and prep loosen to match. The money is spent whether or not prices actually rise. |
| 3. Midpoint with two triggers | A midpoint for the board plus a written rule for when the number changes. Slightly more to explain, once. | A target that moves with the market on an agreed schedule, so a cost swing shows up as a trigger review rather than as a surprise variance. |
My recommendation is option 3. Put the midpoint in the budget. Beside it, write the two triggers in plain words: the low trigger and the high trigger. For eggs, a reasonable pair would sit well inside USDA’s interval, because the interval is so wide that the ends are not useful as alarms. For fats and oils, the published ends are usable as they are. Then agree on one thing now, in November: when a trigger fires, purchasing and operations re-forecast that category within two weeks, and finance does not treat the move as a miss.
What does the CFO want that the ops team is wary of?
This is the real tension, and it is worth writing down because the memo will land on both desks.
The CFO wants one number because the board, the lender and the bonus plan all key off it. A range looks like hedging. A trigger plan looks like an excuse written in advance.
The VP of Operations wants a range because the kitchen cannot hold a midpoint on a category USDA says could move 70 points either way. If the only number in the plan is the midpoint, the kitchen has two choices in a bad quarter: miss the number, or order and prep to the number and absorb the waste. Neither is good.
The way through, in my experience, is to make the midpoint the public number and the triggers the operating number. Finance keeps its one figure for the deck. Operations keeps its permission to change course. The agreement is written in November so no one has to negotiate it in April.
What should purchasing and operations do with the range now?
Three concrete moves, in order.
1. Sort your ingredient spend by range width, not by dollar size. The categories that need the most attention in 2027 are the wide ones: eggs, fats and oils, beef and veal, fresh vegetables. A category can be a small share of spend and still be the one that blows the number, because its range is wide.
2. Decide where the swing gets absorbed. A price swing can be absorbed in three places: the menu price, the portion, or the prep and order quantity. The third one is the one place where a group can respond within a week and without the guest noticing. That is why forecast-driven prep and ordering matters more in a wide-range year than in a tight one. If prep follows demand closely, a cost increase hits fewer wasted units.
3. Put the November 24 update on the calendar. USDA typically refreshes the outlook on the 25th of each month, or earlier when the 25th falls on a weekend or holiday. The next release is scheduled for November 24, 2026. Whoever owns the budget should read the 2027 intervals that day and note which categories moved. If a trigger has already fired before the year starts, the budget should say so.
Where this fits with what we published earlier: our 2026 food cost post, 2026 Food Costs: What’s Rising, by How Much, and What You Still Control, used the September 2026 edition of the same outlook and focused on this year. The October edition revised the 2026 midpoints, so where a 2026 figure here differs from that post, the figure here is the newer one. Our October 19 post on menu prices versus grocery prices quoted the 3.5 percent 12-month change in menu prices to September 2026. USDA’s 3.5 percent figure for 2026 in this post is a calendar-year average forecast, which happens to match the 12-month figure but is measured differently.
Is this a budgeting problem or a forecasting problem?
Both, and they get solved by different people. The budgeting problem is finance’s: how to carry uncertainty in a plan without looking indecisive. The forecasting problem is the kitchen’s: how to keep ordering and prep tight enough that a price swing lands on fewer units.
Groups that run ingredient-level forecasting are in a better position on the second problem. The Groucho’s Deli team describes how a 31-unit franchise system uses ingredient-level forecasting to protect margins across the system, and the Palenque Group case covers how a fast-casual Mexican brand replaced prep guesswork and brought food costs down. Neither case is about 2027 prices. Both are about the same mechanism: when the forecast drives the order, a cost swing has less waste to multiply.
To be fair about fit: if your group is under 10 locations and your purchasing is centralized through one distributor with fixed quarterly pricing, a range-based budget on its own will carry you a long way, and software like ours is not where the money is. The forecasting side pays off when there are enough locations and enough daily ordering decisions for small errors to compound.
Recommendation, for the memo
Budget 2027 food cost at the USDA midpoints by category. Write a low trigger and a high trigger beside each wide category (eggs, fats and oils, beef and veal, fresh vegetables). Agree now that a fired trigger means a two-week category re-forecast rather than a variance review. Re-read the intervals on November 24. And make sure prep and ordering follow the daily forecast, because that is the lever that moves inside a week.
If you would like to talk through what ingredient-level forecasting looks like for a group your size, Let’s Talk.
Disclosure and method
ClearCOGS sells restaurant forecasting software, so we have a commercial interest in operators running prep and ordering from a forecast. All USDA figures above were read directly from the Economic Research Service’s Food Price Outlook summary page and data file dated October 23, 2026; the figures are annual-average forecasts, not seasonally adjusted, and USDA will revise them on November 24, 2026. USDA’s categories are retail consumer price indexes and do not measure wholesale or distributor prices. The 12-unit fryer-oil example is hypothetical and labeled as such; the arithmetic is USDA’s percentages applied to an assumed $216,000 annual spend. The trigger-based approach is my recommendation from operating experience rather than a USDA method. Written November 3, 2026.
Sources
- USDA Economic Research Service, Food Price Outlook, Summary Findings, updated October 23, 2026: ers.usda.gov/data-products/food-price-outlook/summary-findings
- USDA Economic Research Service, Changes in Consumer Price Indexes, 2024 through 2027 (data file), last updated October 23, 2026, next update November 24, 2026: ers.usda.gov/data-products/food-price-outlook


