Your demand is more predictable than a restaurant’s, so your tools shouldn’t be less. A Tuesday night game, a sold-out concert, a homecoming weekend, a Saturday banquet, all known months in advance. ClearCOGS uses the inputs that actually drive your demand (event calendar, projected attendance, presale velocity, promotions, and weather) to deliver per-stand, per-shift prep, order, and labor recommendations.
Who We Serve
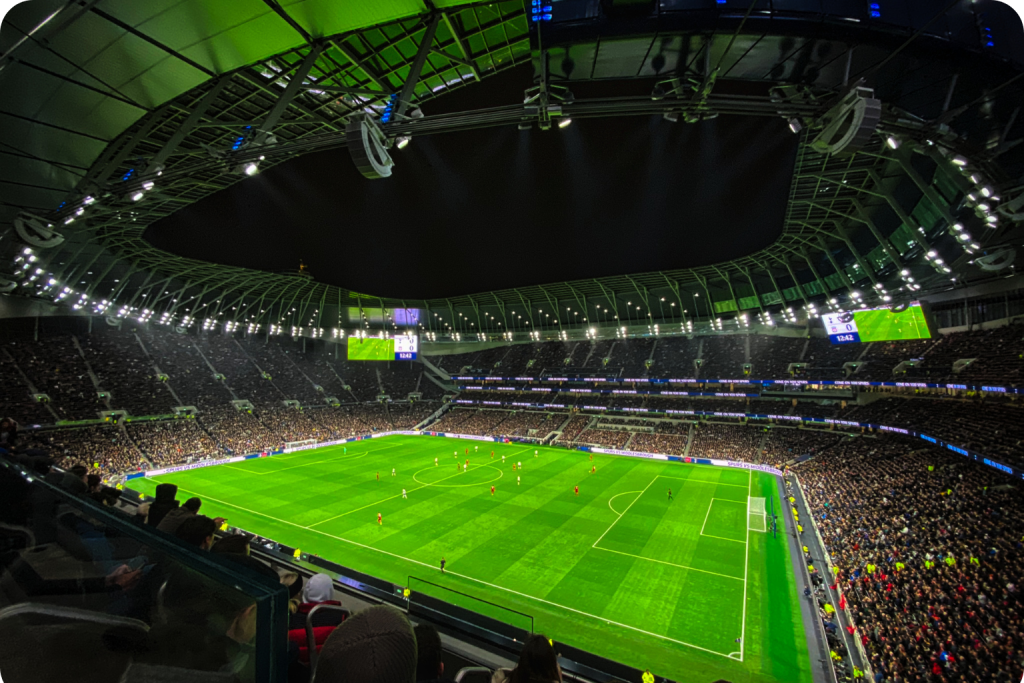
Stadiums & Arenas
Minor and major league ballparks, college athletics, concert and event arenas.
Entertainment & Experience Venues
Golf ranging, bowling, family entertainment centers, casinos, food trucks.
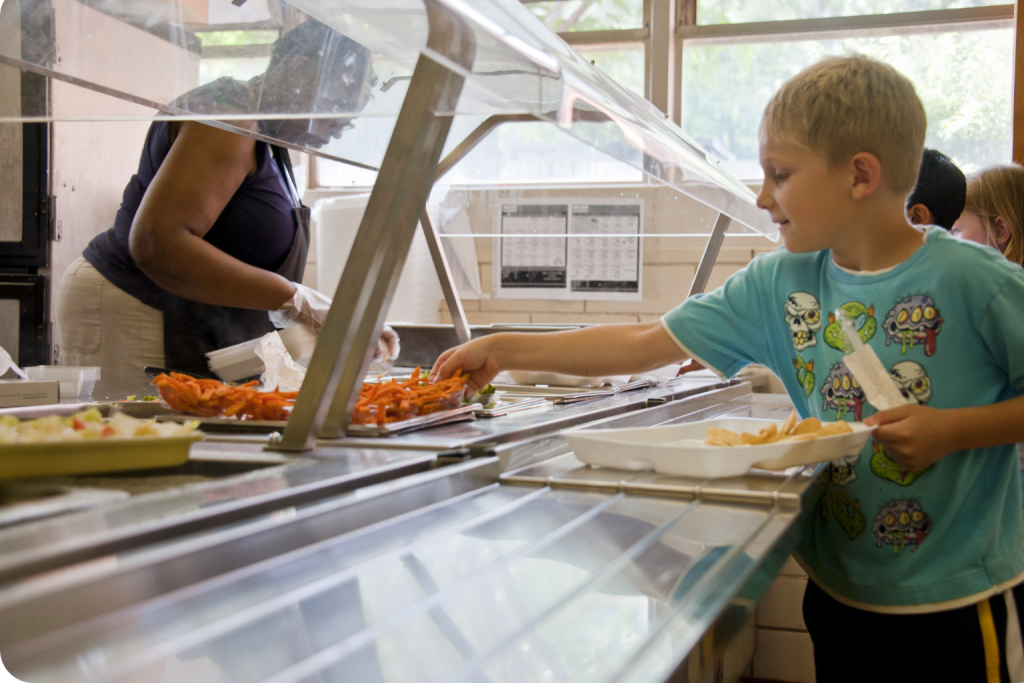
Schools & Universities
K–12 food service and campus dining.
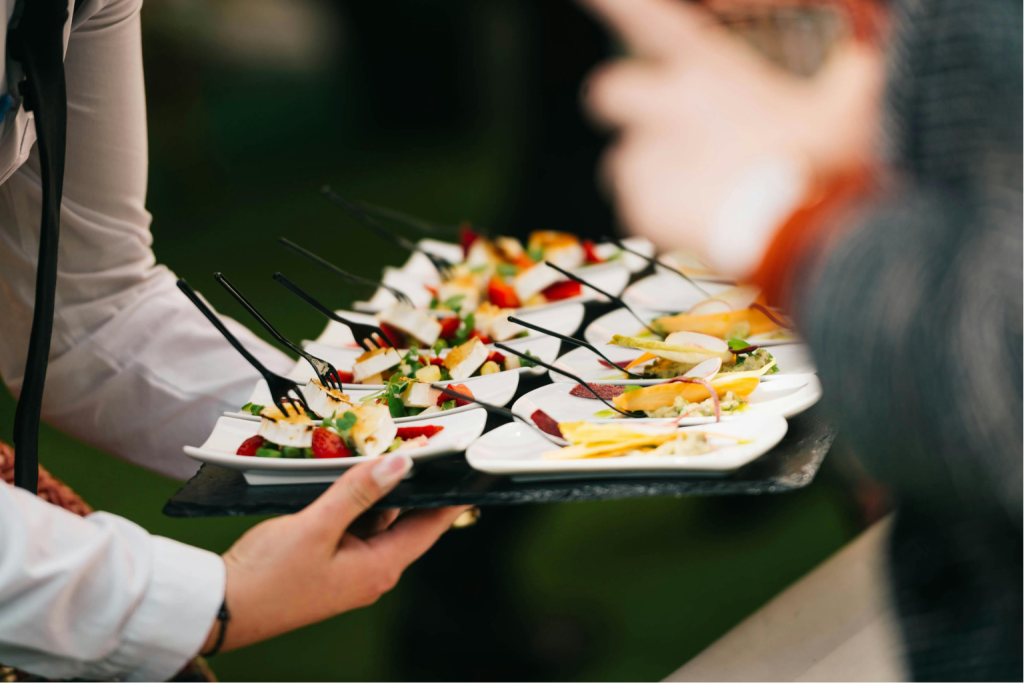
Hotels & Hospitality
Banquets, in-room dining, restaurant outlets, and grab-and-go.
Healthcare & Senior Living
Resident meal programs, retail cafés, and catering.
Resorts, Agri-Tourism & Seasonal Operations
Ski resorts, farms, fairs, and seasonal attractions.
Stop forecasting like a restaurant. Start planning like a venue.
Tell us about your venue and we’ll show you a pilot scope built around your needs.
Have a question we haven’t covered? See our full FAQ →
For assistance, please visit our Contact Us page. Our dedicated team is ready to help you on your journey to a greener, more sustainable future.
Yes, that’s the core reason we built the Venues & Institutions practice. ClearCOGS pulls from your event calendar, ticketing and pre-sale data, projected attendance, weather, and historical no-show rates by event type — then breaks the forecast down to the stand, kitchen, or concession level. A Tuesday night minor-league game with rain in the forecast generates a different prep sheet than a sold-out Saturday concert. The system was designed for operations that know their demand months in advance and need to plan against it.
No. ClearCOGS sits on top of your existing systems — POS, event management, ticketing, banquet event orders. We pull what we need automatically and deliver the daily prep sheet by email. Your ops team keeps the tools they already use; the forecast just shows up before your morning huddle. Most venues we work with had at least one process that started on a whiteboard and now runs through ClearCOGS without anyone changing their workflow.
We model them. Most venues over-forecast because they prep against paid attendance — we calibrate against your historical no-show rate by event type, day-of-week, weather, time of year, and promotional context. For weather-sensitive operations (outdoor stadiums, ski resorts, agri-tourism), we ingest weather forecasts into the model. Premium seating, hospitality decks, and walk-up demand are forecasted separately so concession projections aren’t systematically biased high.
Yes. We integrate with the major restaurant POS systems (Toast, Square, NCR, Oracle, and others) and we can work with common venue and institutional tooling — Tessitura, Ticketmaster Archtics, Bypass, Appetize, Verifone, and several school and healthcare food-service platforms. If we don’t have a direct integration today, we can almost always work with your data exports or pull from your back-office reporting system. Ask us about your stack on a discovery call.
A typical pilot runs 8–12 weeks across a defined set of locations or events — long enough for the forecast to learn from your data and for your team to see the operational impact. We agree on success criteria upfront: forecast accuracy by item type, food cost movement, labor variance, manager time saved. After the pilot, our implementation team owns the technical onboarding to additional venues so your operations team stays focused on running events.