

By Matt Wampler, CEO of ClearCOGS
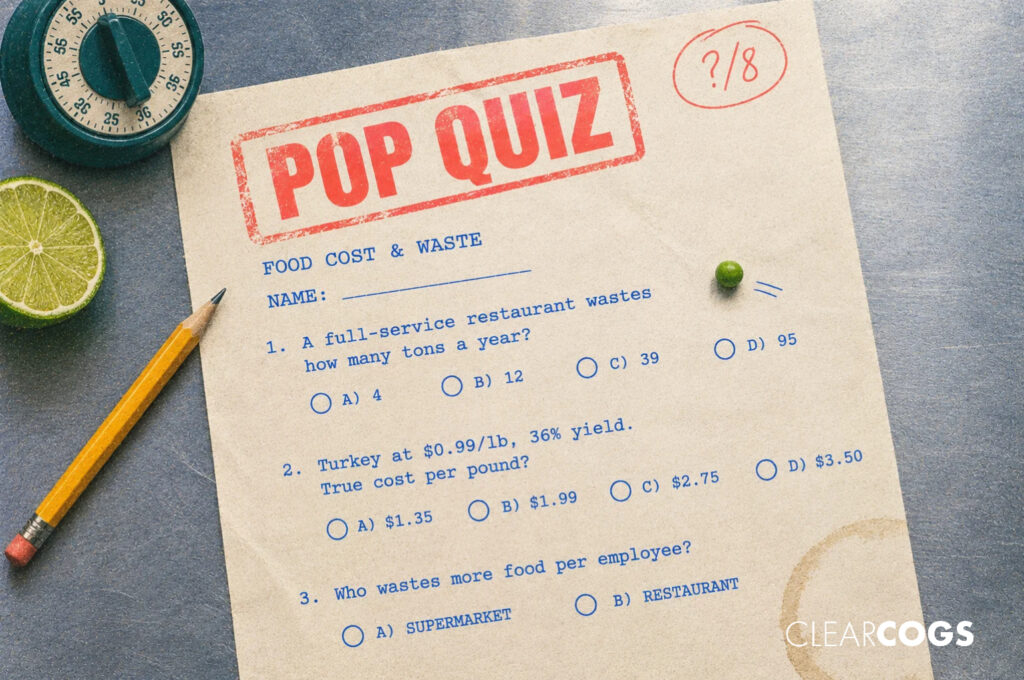
Eight questions on restaurant food cost and waste. Every answer comes from a government report or a university costing text, with the source named under each one. Guess first, then tap to check. Keep a tally; the score bands are at the end.
Short on time? Tap to see the three biggest answers (spoilers)
Three facts from this quiz tend to surprise people: a full-service restaurant generates about 39 tons of wasted food a year, food service accounts for about 40% of the wasted food from retail, food service and homes combined, and a supermarket wastes more food per employee than a restaurant does. All three are from the U.S. EPA’s 2019 Wasted Food Report.
A note on the numbers before you start. The waste figures come from the U.S. Environmental Protection Agency’s 2019 Wasted Food Report, which is the most recent national estimate with this level of detail. EPA’s “food service” category includes restaurants, hotels, schools and hospitals, and EPA says its figures may overstate current waste because the underlying studies predate recent landfill rules. The point of the quiz is the scale and the shape of the problem, not a benchmark to hit.
Round 1: The size of the problem
Question one. In the most recent USDA estimate, what share of the U.S. food supply at the retail and consumer level went uneaten?
A) 11 percent B) 21 percent C) 31 percent D) 41 percent
Tap for the answer
C, 31 percent. USDA’s Economic Research Service estimated that 31 percent of the available food supply at the retail and consumer level went uneaten in 2010, about 133 billion pounds. “Consumer level” in that study includes restaurants as well as homes. The data are from 2010, so treat the number as the best national benchmark rather than a current reading.
Source: USDA ERS, Economic Information Bulletin 121 (2014).
Question two. EPA counted 66 million tons of wasted food from retail, food service and households in 2019. What share came from food service?
A) 10 percent B) 20 percent C) 40 percent D) 60 percent
Tap for the answer
C, about 40 percent. Food service generated roughly 40 percent of the 66.2 million tons EPA counted across the three sectors, with households and retail making up the rest. Remember that EPA’s food service includes institutions as well as restaurants.
Source: U.S. EPA, 2019 Wasted Food Report, Executive Summary.
Question three. Of that wasted food, how much ended up in a landfill?
A) About 15 percent B) About 35 percent C) About 60 percent D) About 85 percent
Tap for the answer
C, about 60 percent. EPA reports 59.8 percent of the wasted food from these sectors was landfilled. For the food service sector alone the share was higher: about 72 percent was landfilled and about 8 percent was composted.
Source: U.S. EPA, 2019 Wasted Food Report, Executive Summary and Section 3.
Round 2: Your building
Question four. How many pounds of wasted food does a full-service restaurant generate per employee per year, by EPA’s estimate?
A) About 750 B) About 1,500 C) About 3,000 D) About 6,000
Tap for the answer
C, about 3,000 pounds. EPA’s factor for full-service restaurants is 3,050.7 pounds per employee per year. Limited-service restaurants come in at 2,751.3. For a 25-person team, that’s about 76,000 pounds a year walking out the back door.
Source: U.S. EPA, 2019 Wasted Food Report, Table 1.
Question five. Per location, how many tons of wasted food does a full-service restaurant generate in a year?
A) About 4 B) About 12 C) About 39 D) About 95
Tap for the answer
C, about 39 tons. EPA’s estimate is 39.1 tons per full-service restaurant per year, and 40.9 tons for a limited-service restaurant. That’s roughly 78,000 pounds, or a bit over 200 pounds a day. If you’ve never weighed a day’s waste, this is the number to test against.
Source: U.S. EPA, 2019 Wasted Food Report, Table 1.
Question six. Which wastes more food per employee: a supermarket or a full-service restaurant?
A) The supermarket B) The restaurant C) About the same
Tap for the answer
A, the supermarket. EPA’s factor for supermarkets is 2.0 tons per employee per year, about 4,000 pounds, against roughly 3,050 for a full-service restaurant. EPA doesn’t say why. In my experience, a lot of restaurant waste is product that was prepped for guests who didn’t come, which is a different problem from unsold product on a shelf.
Source: U.S. EPA, 2019 Wasted Food Report, Table 1 and Section 3.
Round 3: Your math
Question seven. For every $1,000 of restaurant revenue, how many pounds of food are wasted, by EPA’s estimate?
A) About 3 B) About 13 C) About 33 D) About 63
Tap for the answer
C, about 33 pounds. EPA’s factor is 33.0 pounds per thousand dollars of revenue, the same for full-service and limited-service restaurants. As a hypothetical, a $2.5 million unit would generate about 82,500 pounds a year, a little over 41 tons. That is close to the per-location figure in question five, which is a useful check that the two factors agree.
Source: U.S. EPA, 2019 Wasted Food Report, Table 1. The $2.5 million example is hypothetical.
Question eight. A whole turkey costs $0.99 a pound and has an edible yield of 36 percent. What is the true cost per usable pound?
A) $1.35 B) $1.99 C) $2.75 D) $3.50
Tap for the answer
C, $2.75. Divide the purchase price by the yield: $0.99 divided by 0.36 is $2.75 per usable pound. That’s the number that belongs on the recipe card, and it is nearly three times the invoice price. The same text works a pork loin cutting test in which 52 percent of the loin becomes usable meat, for a cost factor of 1.79. If your recipe costs use invoice prices, your food cost is understated on every item that loses weight in prep.
Source: Egan, “Recipe and Menu Costing,” Penn State HM 329 open textbook (CC BY 4.0).
How did you score?
Count your correct answers out of eight and find your band.
7 or 8: Walk-in Whisperer
You know the scale of the problem and you cost by yield. The next question is whether your prep plan is built on a forecast or on habit.
4 to 6: Solid on the Line
You’ve got the kitchen math. The national numbers probably surprised you, which usually means waste is being tracked by feel rather than by weight.
0 to 3: Time for a Yield Test
Start with question eight. Re-cost your top ten items by usable yield this week, then weigh one day’s waste. Both will change what you order.
What to do with your score
Whatever band you landed in, the quiz points at the same two gaps. The first is yield: recipe cards costed at invoice price understate food cost on every protein, every vegetable that gets trimmed, every sauce that reduces. Question eight is the fix, and it’s a spreadsheet afternoon. The food prep guide covers the prep side of the same math.
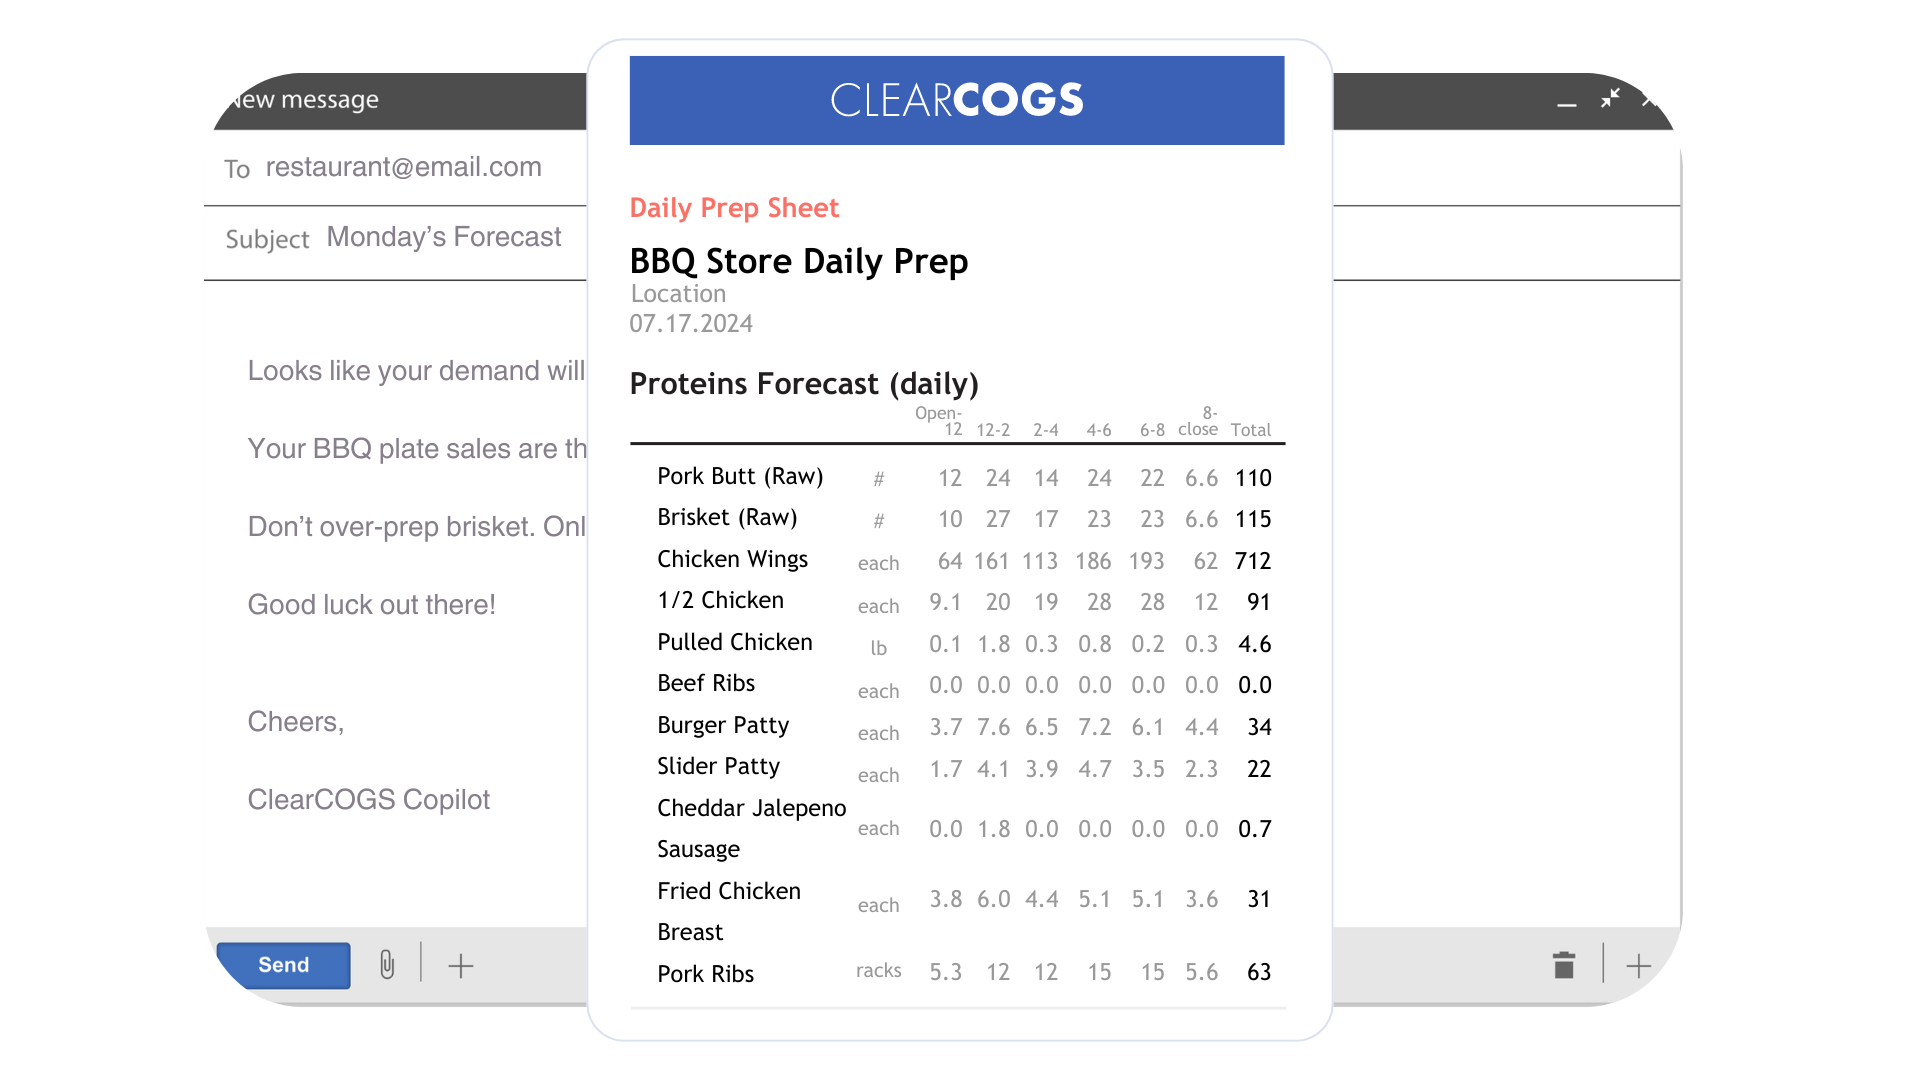
The second gap is the one the EPA numbers describe. Thirty-nine tons a year per location is a lot more than trim and plate scrapings. A large share of it, in my experience, is product that was prepped, held, and thrown away because the guests it was prepped for didn’t come. That is a forecasting problem, and it is the one ClearCOGS exists to solve: forecast guests and items by day and by hour from your own POS history, build prep to that number, and watch what happens to the end-of-night waste. The barbecue case study is a good small example of what that looks like, starting with ribs, and this older post explains the difference between forecasting sales and forecasting prep, which is where a lot of groups stop halfway.
Two quick translations for the people who don’t run the kitchen. Finance: take the yield gap on your top ten items and multiply it by monthly protein spend; that’s the understatement in your food cost line. Data and IT: the EPA factors only become useful once waste is weighed and logged somewhere the POS item sales can sit next to it, so the first project is a daily waste field in the POS or inventory system, and the dashboard comes later. And if you scored well on the math and badly on the national numbers, you’re in the most common spot I see: good kitchen discipline, no measurement of the outcome. Weigh one day’s waste at one store this week. Then we can talk about what a forecast would do to that number. Let’s talk when you have it. And if your team spends more hours prepping than the schedule shows, this post on prep hours is the companion piece.
About the author
Matt Wampler is the CEO and Co-Founder of ClearCOGS. Before founding the company, he ran Jimmy John’s franchise restaurants in the Washington, D.C. suburbs. He hosts the Restaurant AI Podcast.
Disclosure and methodology
Waste figures (questions two through seven) are from the U.S. Environmental Protection Agency’s 2019 Wasted Food Report (EPA 530-R-23-005, April 2023, corrected April 2024). EPA’s “food service” category covers restaurants together with hotels, schools, hospitals and similar institutions, and EPA notes that its generation factors rest on a small number of studies, some of which predate state landfill bans, so they may overstate current waste. The per-employee, per-facility and per-revenue factors are national averages and will not match any one restaurant. The 31 percent figure (question one) is from USDA Economic Research Service Economic Information Bulletin 121 (2014), based on 2010 data; its “consumer level” includes restaurants and households together. The yield math (question eight) is from an open hospitality management textbook by Beth Egan at Penn State, licensed CC BY 4.0; the turkey and pork loin figures are teaching examples rather than industry benchmarks, and your yields will differ. The 25-person team and the $2.5 million unit are hypothetical. The three score bands are a reading aid rather than a validated assessment. ClearCOGS sells forecasting software, so read the last section with that in mind.
Sources
- U.S. Environmental Protection Agency, 2019 Wasted Food Report, EPA 530-R-23-005, April 2023 (corrected April 2024). Executive Summary, Section 3 and Table 1.
- Buzby JC, Wells HF, Hyman J. The Estimated Amount, Value, and Calories of Postharvest Food Losses at the Retail and Consumer Levels in the United States, USDA Economic Research Service, EIB-121, February 2014, summary.
- Egan B. Chapter 7: Recipe and Menu Costing, in Introduction to Food Production and Service, Penn State University (Pressbooks). Licensed CC BY 4.0.
Last reviewed: October 21, 2026