



By Matt Wampler, CEO of ClearCOGS
Restaurant menu prices rose 3.5% in the 12 months to September 2026. Grocery prices rose 1.8%. That’s the headline from the Bureau of Labor Statistics’ latest Consumer Price Index, released October 14, and it means eating out is getting more expensive almost twice as fast as eating at home. At the same time, Census data show restaurant sales up 7.0% from a year ago. Those three numbers sit at the center of a lot of planning meetings right now, and a lot of what gets said in those meetings doesn’t match the data.
Below are six things I hear operators say about this fall’s numbers. Tap each one to see whether the data backs it up. Then there’s a short bit of math on why this matters for how you forecast, and a table of what each role in a restaurant group should check this week.
How much of this year’s restaurant sales growth is just price?
About half. Sales are up 7.0% and menu prices are up 3.5%, so price explains roughly 50% of the growth.
Sources: U.S. Census Bureau advance retail sales, food services and drinking places, September 2026; BLS CPI, September 2026.
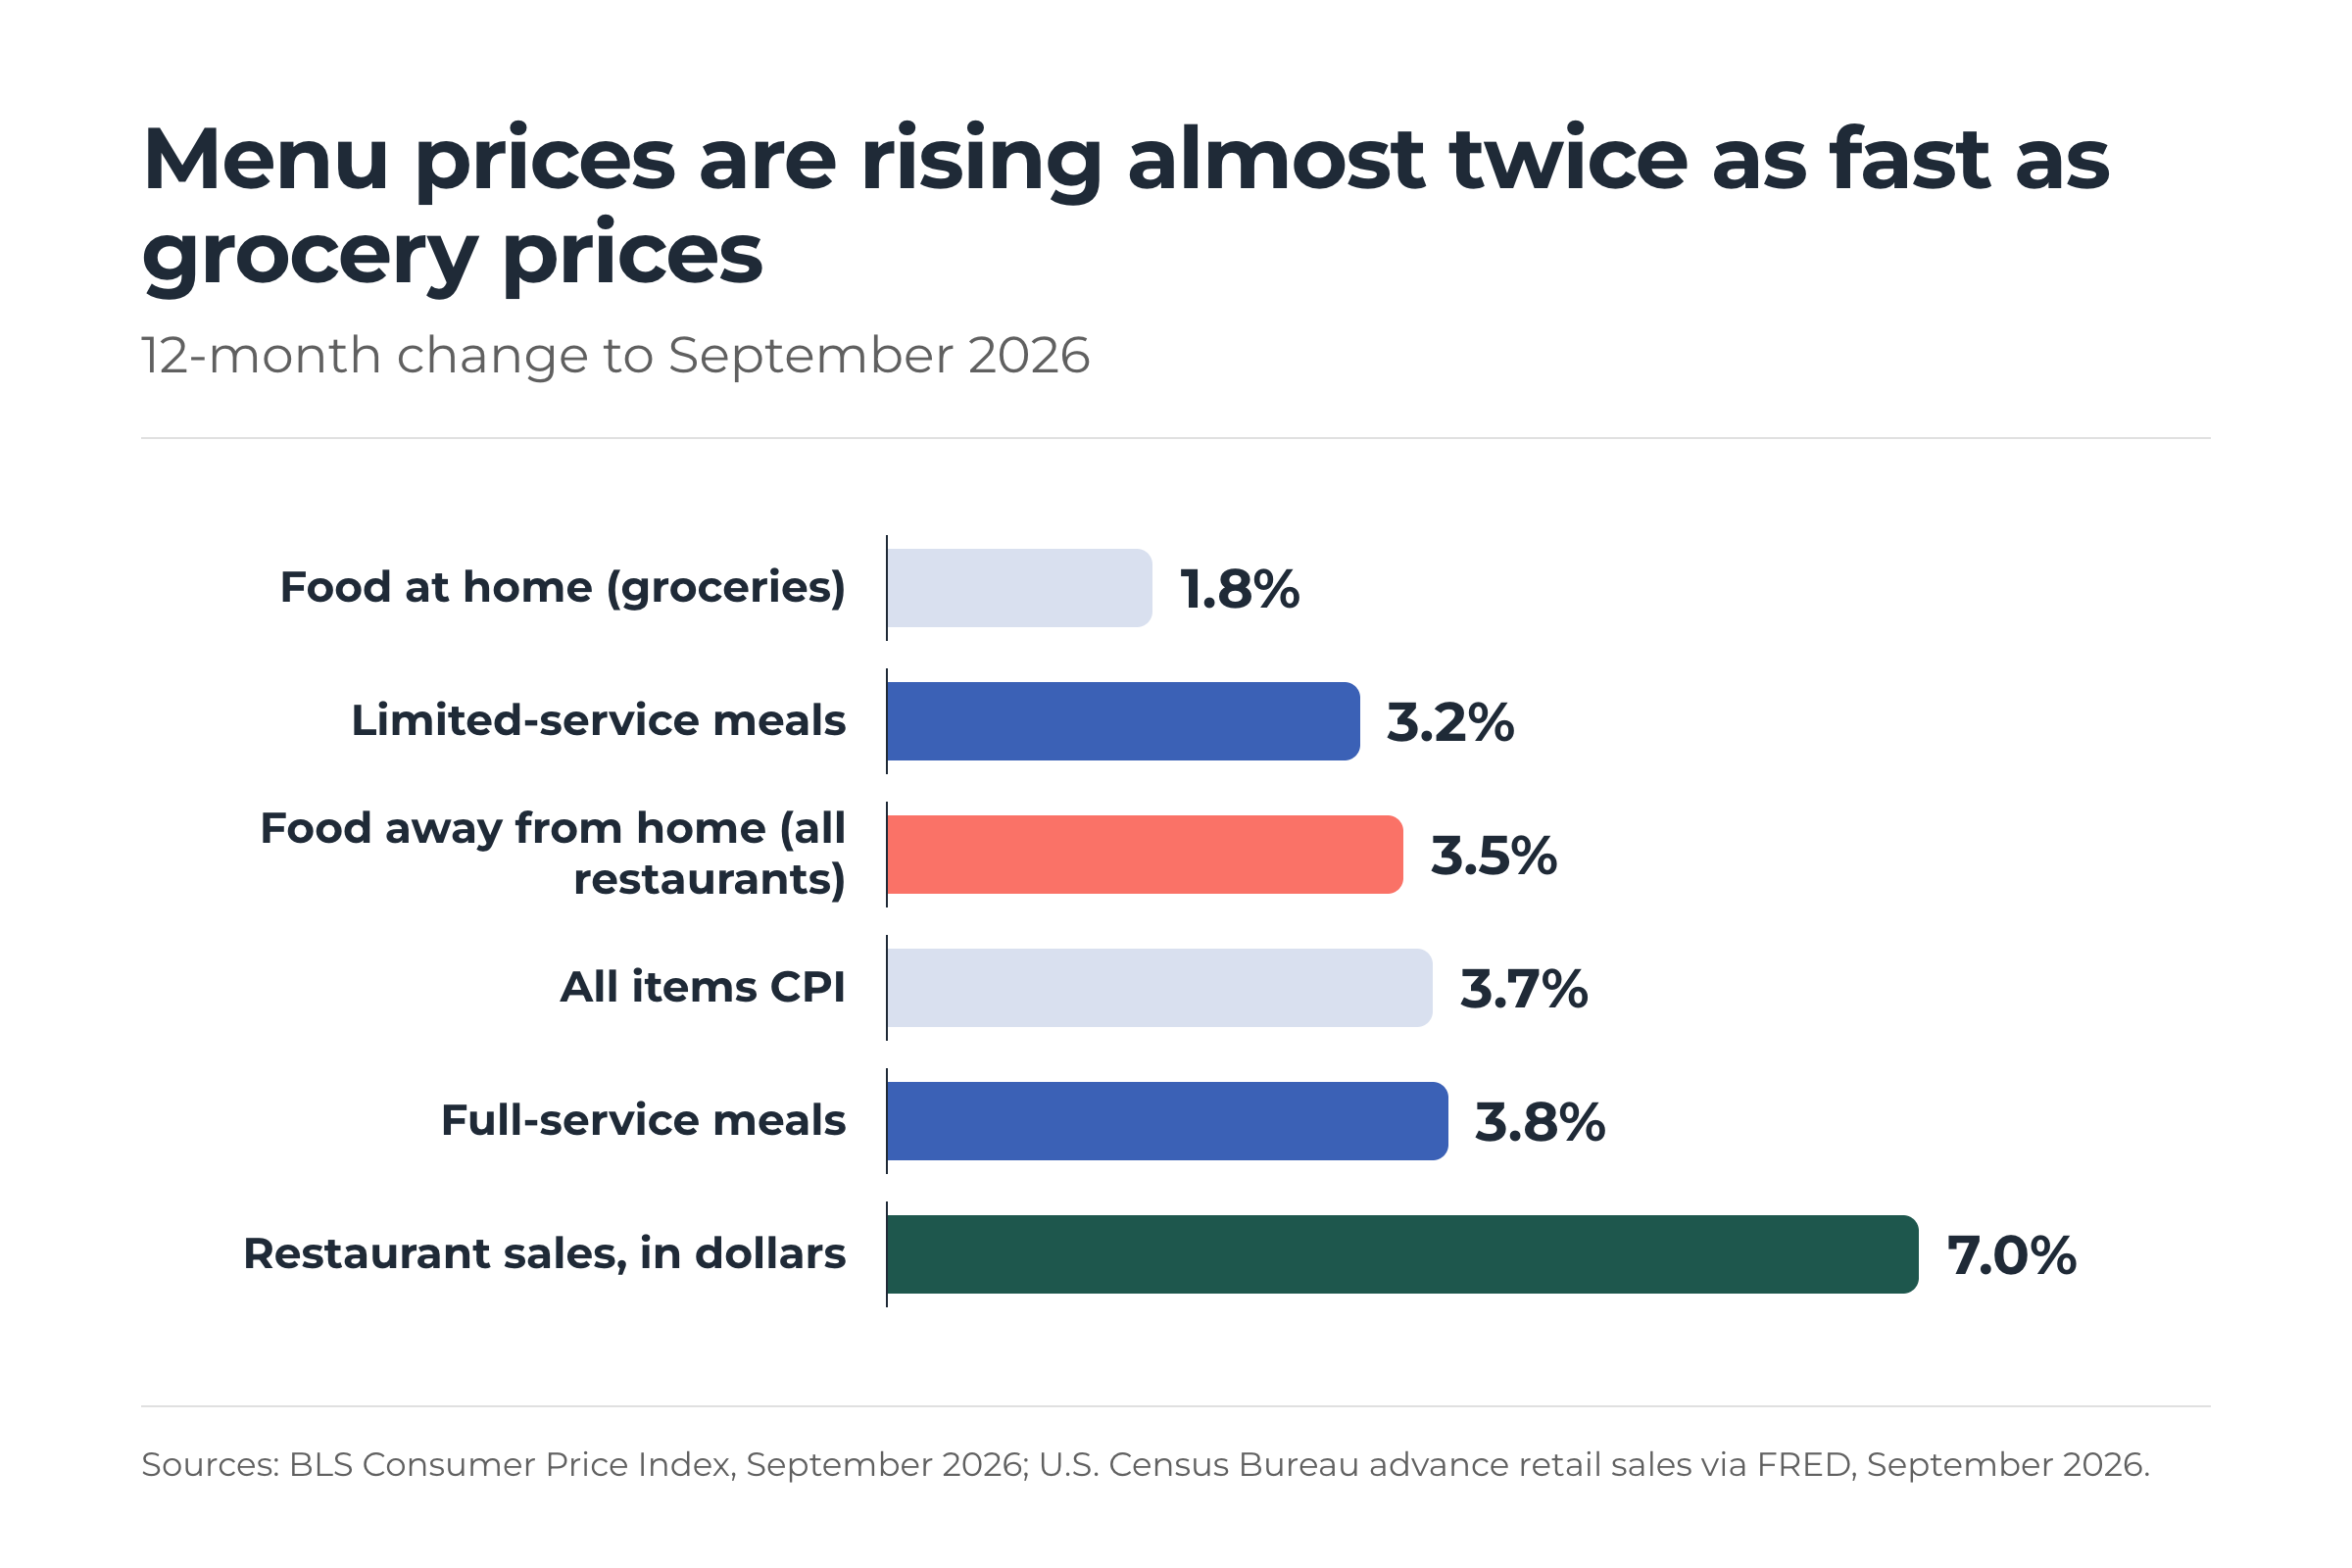
Twelve-month change to September 2026. Sources: BLS Consumer Price Index; U.S. Census Bureau via FRED.
Are grocery prices falling in 2026?
“Grocery prices are falling, so guests are trading down to cooking at home.” Myth or fact?
Myth, with a real worry inside it. Grocery prices aren’t falling. The food-at-home index rose 1.8% over the year to September 2026. What’s true is the gap: restaurant prices rose 3.5%, so the price of eating out moved 1.7 points further away from the price of eating in. That gap is what pushes a guest to cook, and it widened this year.
The detail matters because the two stories lead to different decisions. If groceries were truly getting cheaper, you’d be fighting a falling price. You’re not. You’re fighting a widening spread, and the spread is mostly on your side of the ledger. Inside the grocery index, some items did fall: eggs are down 20.6% over the year, butter is down 10.3%, and dairy as a group is down 0.7%. Others rose: coffee is up 7.1%, and fruits and vegetables are up 3.7%. The average landed at 1.8%.
Are restaurant sales down in 2026?
“Restaurant sales are shrinking.” Myth or fact?
Myth, in dollars. Census data put September 2026 sales at food services and drinking places at $92.9 billion, seasonally adjusted, up from $86.8 billion in September 2025. That’s a 7.0% gain, and the eighth month in a row the number rose. After stripping out the 3.5% rise in menu prices, growth is closer to 3.4% in real terms. Smaller, but still positive.
“Sales are up 7%, so we have 7% more guests.” Myth or fact?
Can’t tell from this data, and that’s the point. Price explains about half of the 7%. The other half is some mix of more guests, bigger checks, and a shift toward higher-priced items. The CPI can’t separate those. Your POS can. If you forecast in dollars and the growth is mostly check size, you’ll overbuild product.
That second card is the one I’d pin to the wall. A 7% dollar number feels like a 7% busier dining room. It isn’t, and the difference lands in the walk-in.
Why are menu prices rising faster than grocery prices?
“Food cost is what’s forcing menu prices up.” Myth or fact?
Partly myth. The grocery basket as a whole isn’t running hot: food at home rose 1.8%, dairy fell 0.7%, and the “meats, poultry, fish and eggs” group rose just 0.3%. But that group average hides a lot. Eggs fell 20.6%, which drags the number down. Pull the staples out and several are rising at or above menu inflation: beef and veal +3.5% over the 12 months to September (USDA’s full-year 2026 forecast, which our food costs post used, is a different measure and runs higher), ground beef +5.4%, fish and seafood +6.9%, tomatoes +6.8%, coffee +7.1%. So the honest answer is that food cost is part of the story for some menus and a small part for others, depending on what you sell. One caution: the CPI tracks retail prices. Your distributor charges something different, so treat this as a signal rather than your invoice.
Full-service menus rose 3.8% and limited-service menus rose 3.2%. Both sit above grocery inflation overall, but a steakhouse buying beef, a seafood house, or a coffee-heavy breakfast concept is feeling real ingredient pressure this year, while a concept built on eggs, dairy and bread is not. The CPI doesn’t tell us the rest of the story in this release, and I won’t pretend it does. The point is to check your own mix before deciding how much of your price increase the food actually explains.
Does one price increase fit every market?
“Inflation is the same everywhere, so one systemwide price move is fine.” Myth or fact?
Myth. Restaurant price inflation over the year to September ranged from 3.1% in the South to 4.3% in the Midwest, with the Northeast at 3.5%, the West at 3.3%, and the New York metro at 3.6%. A group with units across regions that takes one systemwide increase is under-pricing in one market and over-pricing in another.
“Gas prices are the delivery drivers’ problem. Restaurants don’t feel them.” Myth or fact?
The number is a fact. The conclusion is a myth. Gasoline is up 34.2% over the year and energy overall is up 20.4%. That hits the guest’s wallet before it hits yours, and it shows up again in distributor fuel surcharges. A guest paying a third more at the pump has less left for the check.
What the gap between price and volume costs you
Here’s the forecasting problem in one hypothetical. Picture a 12-unit casual dining group. Last December, one unit did $220,000 in sales. The team builds this December’s plan the way most teams do: take last year, add the growth rate the industry is posting, and prep to it.
What happens if you prep to the dollar forecast? Hypothetical example. No customer data.
Step 1: The dollar forecast
$220,000 last December, plus 7.0% to match the industry sales trend, equals a $235,400 forecast for this December.
Step 2: The volume the data actually supports
Strip out 3.5% menu inflation and the real growth is about 3.4%. $220,000 plus 3.4% is $227,480 of last year’s product. If prep sheets scale with the dollar forecast instead, every item is built about 3.5% too high.
Step 3: What that overbuild is worth
The gap between the two forecasts is $7,920 of sales. At a 30% food cost, that’s about $2,380 of product per unit per month bought and prepped for guests who aren’t coming. Across 12 units, that’s roughly $28,500 a month. That’s an upper bound. Not every extra pan of mashed potatoes becomes waste, but some of it does, and the rest costs labor to make and space to hold.
The fix isn’t complicated. Forecast guests and items, then let dollars fall out of the mix and the menu price. If you forecast dollars first and back into prep, every point of menu inflation becomes a point of over-production. I ran Jimmy John’s franchises for years, and the fastest way I know to turn a good sales month into a bad food-cost month is to confuse the two.
This is the layer ClearCOGS works in. Our forecasts are built at the item and hour level from your POS history, so a price increase moves the dollar line without inflating the prep line. If you want to see what that looks like at a franchise scale, the 83 Subs story is a 17-location example built around bread, and the Goop Kitchen write-up shows the margin side.
What to check this week, by role
| Role | The number to pull | Why it matters now |
|---|---|---|
| Finance | Same-store sales split into price, check and guest count, by month | A 7% dollar gain with price at 3.5% is a 3.4% story. Budget and bonus targets should reflect the real figure. |
| Operations | Whether prep sheets scale with dollars or with item counts | If build-to numbers moved with the sales forecast, you’re carrying the overbuild in the math above. |
| Data and IT | Guest count and item-level sales exported cleanly from the POS, by hour | The CPI can’t split price from volume. Your POS can, but only if the fields are reliable and someone is looking. |
| Franchise and multi-region leaders | Regional food-away-from-home inflation for each market you operate in | A 3.1% South and a 4.3% Midwest shouldn’t get the same price move or the same forecast adjustment. |
One more thing on timing. Whatever sales trend you plan to, make sure your order covers the delivery lead time, not just the week. I wrote about that in You’re Not Ordering for Next Week, and the holiday weeks make it worse. If the terms in this post are new to you, the plain-English guide to demand forecasting is the place to start.
Frequently asked questions
How much did restaurant prices rise in 2026?
According to the BLS Consumer Price Index for September 2026, the food-away-from-home index rose 3.5% over the previous 12 months. Full-service meals rose 3.8% and limited-service meals rose 3.2%.
Are restaurant prices rising faster than grocery prices?
Yes. Over the 12 months to September 2026, restaurant prices rose 3.5% while grocery prices (food at home) rose 1.8%, a gap of 1.7 percentage points.
Are restaurant sales growing in 2026?
In dollars, yes. The Census Bureau’s advance estimate put September 2026 sales at food services and drinking places at $92.9 billion, seasonally adjusted, up 7.0% from September 2025. Adjusted for the 3.5% rise in menu prices, real growth was closer to 3.4%.
Should restaurants forecast sales in dollars or in guest counts?
For prep and purchasing, forecast guests and items, then calculate dollars from the forecast and your menu prices. Forecasting dollars first and scaling prep to match turns every point of menu inflation into over-production.
Bottom line
The September 2026 data say three things at once: eating out is getting pricier faster than eating in, restaurant sales are still growing in dollars, and about half of that growth is price. None of those is a reason to panic. All three are a reason to stop forecasting in dollars. Build the plan in guests and items, price it afterward, and check the regional number before you take a systemwide increase.
Want to see how your group’s sales growth splits between price and volume?
ClearCOGS forecasts at the item and hour level from your own POS data, so menu prices move the dollar line without inflating prep. We’ll walk you through what it looks like for your stores.
About the author
Matt Wampler is the CEO and Co-Founder of ClearCOGS. Before founding the company, he ran Jimmy John’s franchise restaurants in the Washington, D.C. suburbs. He hosts the Restaurant AI Podcast.
Disclosure and methodology
Price figures come from the Bureau of Labor Statistics’ Consumer Price Index for All Urban Consumers, September 2026 release (October 14, 2026). The CPI measures retail prices paid by urban consumers. It does not measure wholesale or distributor prices, so the grocery-level numbers here are a signal about ingredient inflation and are no substitute for your invoices. Regional figures come from the BLS regional CPI releases for the same month and are not seasonally adjusted. Sales figures come from the Census Bureau’s Advance Monthly Retail Trade report for food services and drinking places, seasonally adjusted, via FRED; the latest month is an advance estimate and will be revised. The “real growth” figure of about 3.4% was calculated by dividing nominal sales growth by the food-away-from-home price index, which is a rough deflator. No guest-traffic data were used; the point about price versus volume is arithmetic rather than a traffic measurement. The 12-unit example is hypothetical and is an upper bound. ClearCOGS sells forecasting software, so read the recommendation section with that in mind.
Sources
- U.S. Bureau of Labor Statistics, Consumer Price Index, September 2026 (USDL-26-1574, released October 14, 2026). Table A and Tables 1 and 2.
- U.S. Bureau of Labor Statistics, Consumer Price Index, September 2026, regional releases: Midwest, Northeast, South, West, New York-Newark-Jersey City.
- U.S. Census Bureau, Advance Retail Sales: Food Services and Drinking Places, seasonally adjusted, retrieved from FRED, Federal Reserve Bank of St. Louis, series RSFSDP, updated October 15, 2026.
Last reviewed: October 19, 2026


