




By Matt Wampler, CEO of ClearCOGS
Quick answer: USDA expects restaurant menu prices to rise 3.5% in 2026 and grocery prices 2.4%, but the ingredients restaurants buy are moving unevenly. Beef and veal are forecast up 9.4%, fresh vegetables 5.7%, while eggs are forecast down 29.4% and dairy is roughly flat (latest Food Price Outlook, September 2026). Operators can’t set ingredient prices. They can set usage: how much gets prepped, how much sells, and how much is thrown away. In a year like this, usage is the food cost line worth managing.
How much are restaurant food costs rising in 2026?
On paper, 2026 looks like a normal year for food prices. One level down, it isn’t.
USDA’s Economic Research Service forecasts all food prices up 2.9% in 2026. Prices at restaurants and other foodservice, which it calls food away from home, are forecast up 3.5%, exactly in line with their 20-year average. Grocery prices are forecast up 2.4%.
But nobody in a kitchen buys “food.” You buy beef, produce, dairy, poultry and coffee, and those categories are going in different directions this year.
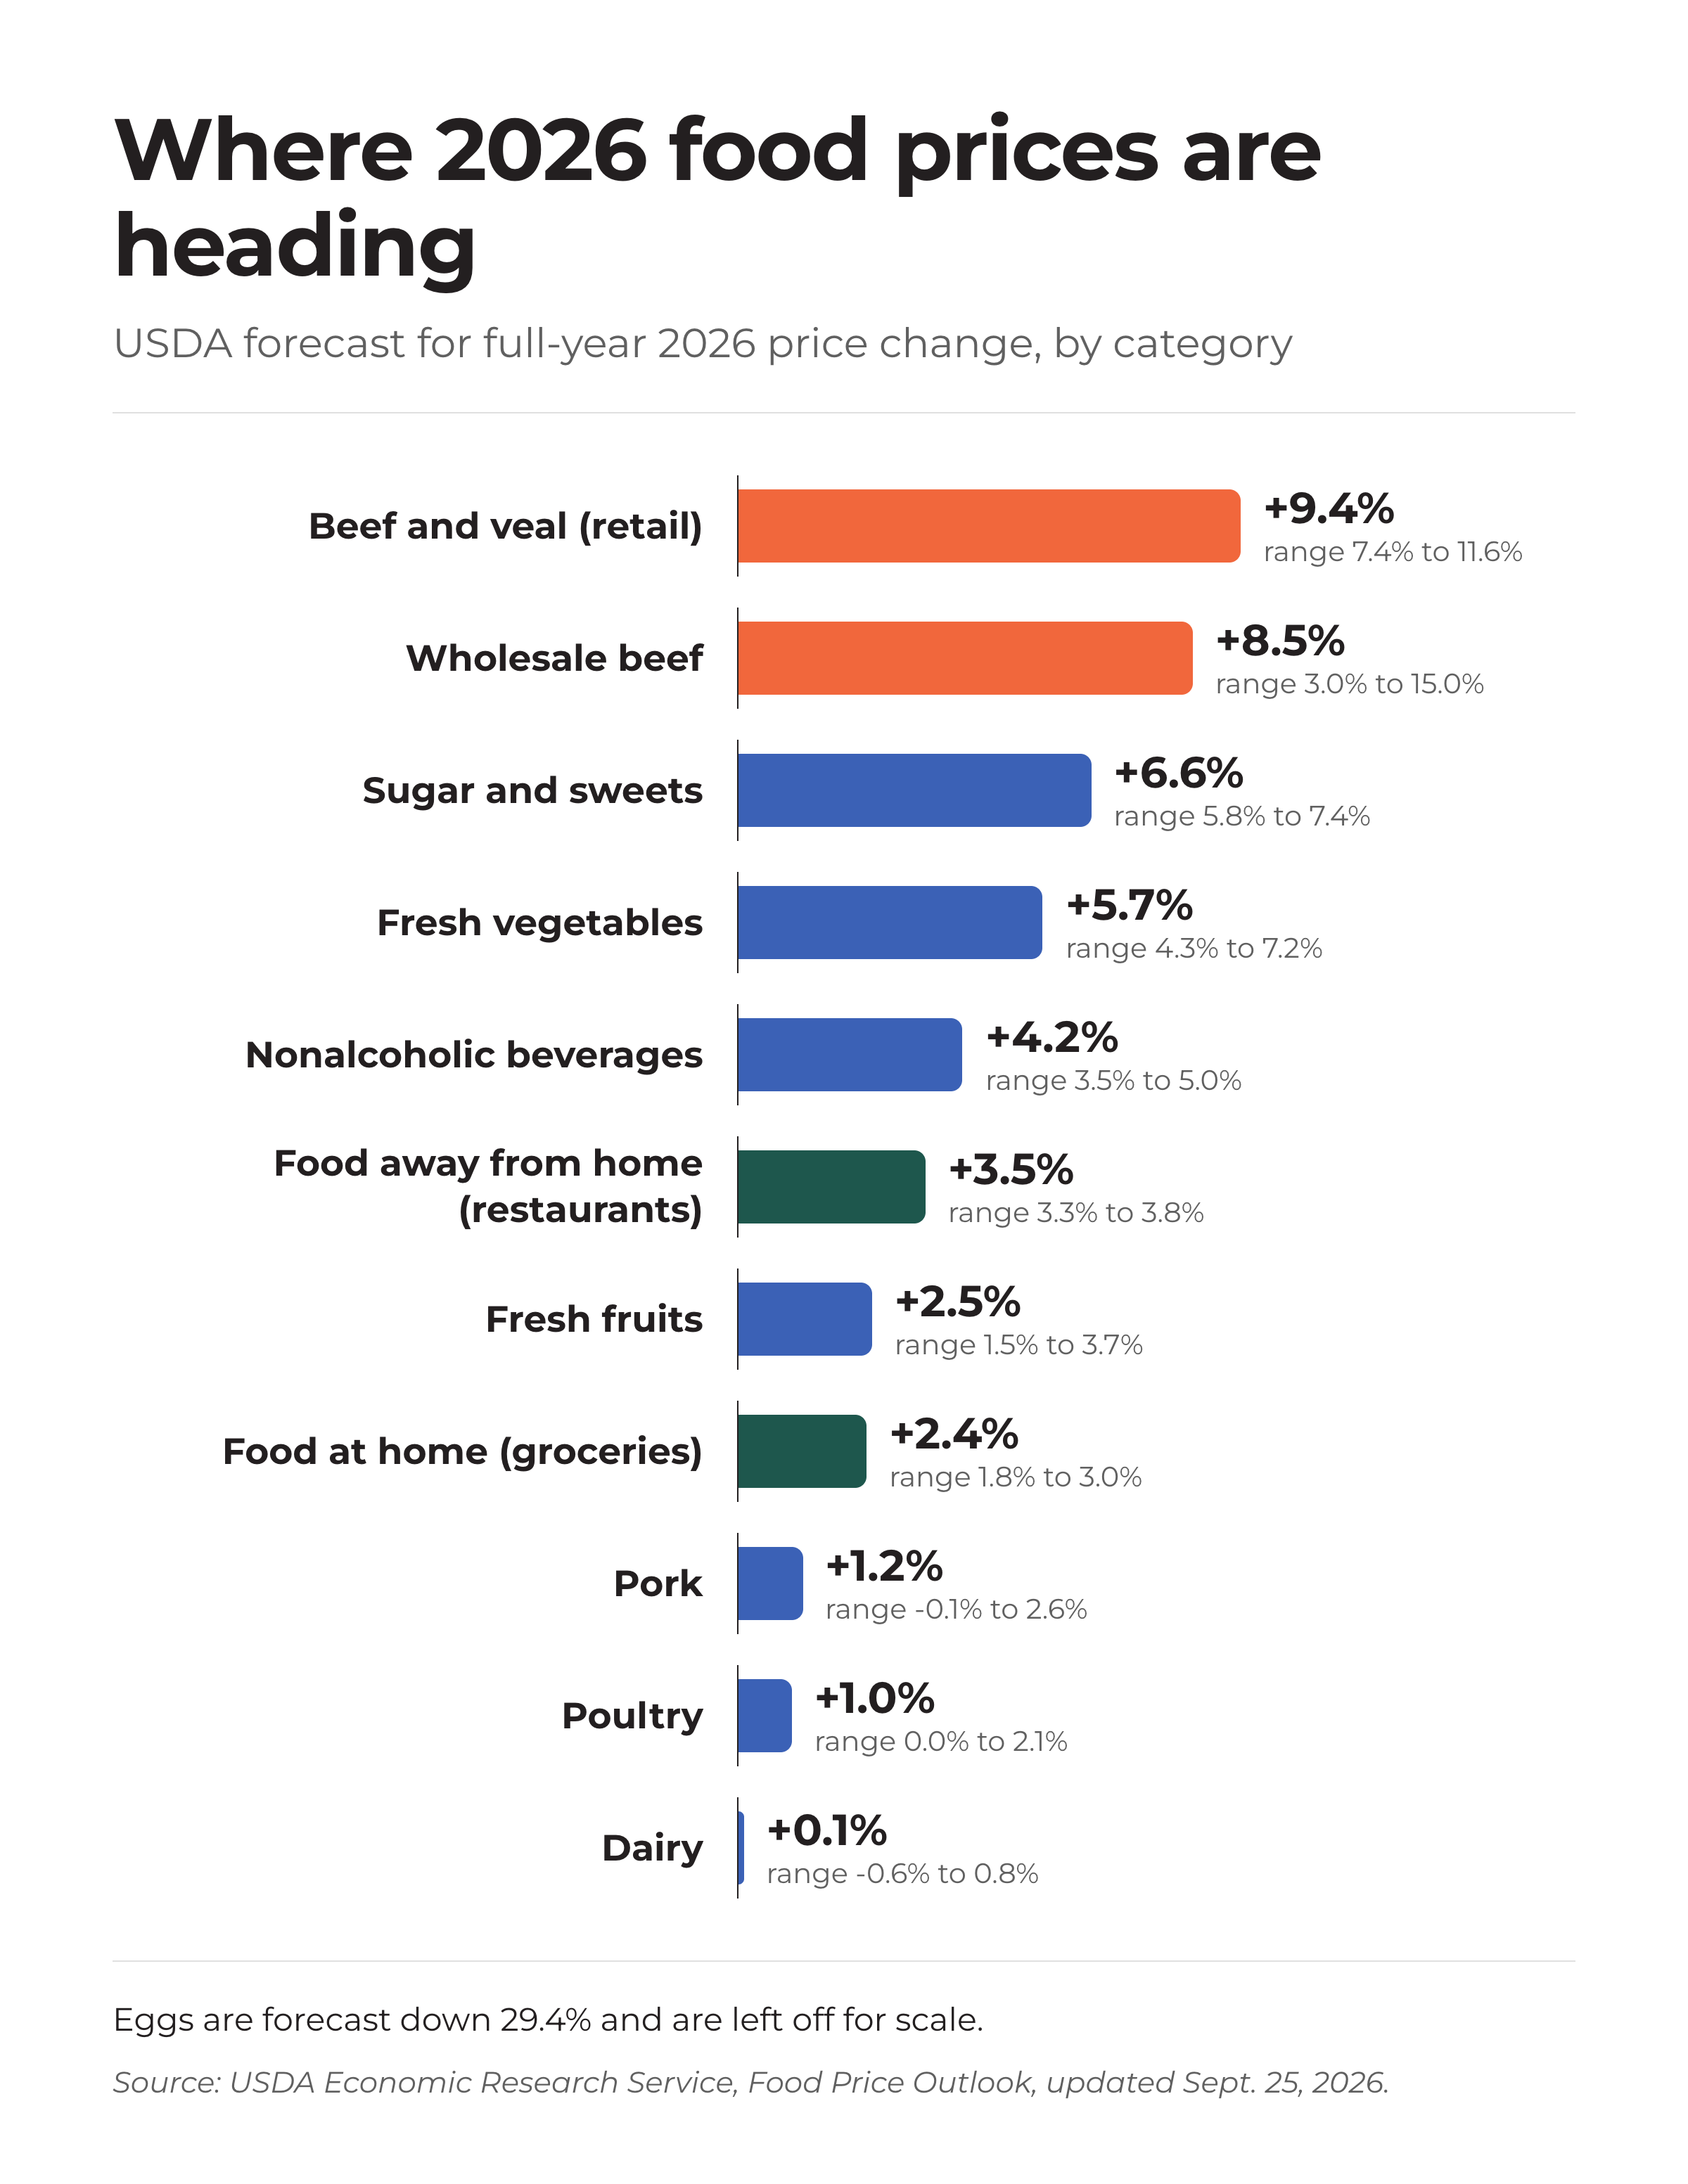
Beef and veal (retail)
+9.4%
Forecast range: 7.4% to 11.6%
Highest-priority item for prep accuracy and portion control
Wholesale beef
+8.5%
Forecast range: 3.0% to 15.0%
Wide range: plan around the high end
Fresh vegetables
+5.7%
Forecast range: 4.3% to 7.2%
Short shelf life, so overprep turns into waste fast
Nonalcoholic beverages
+4.2%
Forecast range: 3.5% to 5.0%
Coffee prices were up 6.1% year over year in August
Pork
+1.2%
Forecast range: -0.1% to 2.6%
Relatively stable alternative protein
Poultry
+1.0%
Forecast range: 0.0% to 2.1%
Relatively stable alternative protein
Dairy
+0.1%
Forecast range: -0.6% to 0.8%
Flat, with cheese under downward pressure from higher milk output
Eggs
-29.4%
Forecast range: -32.9% to -25.2%
Falling after four years of avian flu shocks
2026 retail price forecasts vs 2025, except wholesale beef. Source: USDA Economic Research Service, Food Price Outlook, updated September 25, 2026.
One detail in those numbers matters more than the midpoints: the ranges. Wholesale beef could land anywhere from 3% to 15% higher. A plan built on the midpoint will be wrong in one direction or the other, and the more expensive mistake is assuming the low end.
Why menu prices can’t absorb all of it
The usual answer to rising costs is to raise menu prices. That still works, but it’s being asked to do a lot right now.
According to the National Restaurant Association (July 2026), restaurant sales are projected to grow 4.3% in 2026, but only 0.8% in inflation-adjusted terms, with traffic uneven and higher menu prices driving much of the growth. Food and labor each take roughly 33 cents of every sales dollar. Wholesale food prices are up 35% since February 2020, average hourly earnings for restaurant employees are up 41%, and 33% of operators said their restaurant was not profitable in the first half of 2026.
In plain terms: menus already went up to cover the last few years. Guests are still showing up, but not in bigger numbers. Every new increase tests how far that goodwill goes.
So the other half of food cost has to carry more of the load.
The two halves of food cost
Picture a kitchen manager at 6am on a Tuesday, opening last week’s numbers to set today’s beef prep. The report says beef ran over target. What it doesn’t say is why. Maybe the price on the invoice went up. Maybe the kitchen cooked more than it sold. Those are two very different problems, and the manager can only fix one of them before lunch.
That’s because food cost is usually reported as one percentage, when it’s actually the product of two different numbers:
Price per unit is set upstream, by cattle herds, weather, freight and tariffs. A single restaurant group has some leverage through contracts and vendors, but not much.
Units used is set in the kitchen. It includes everything that was sold, plus everything that was prepped and not sold, plus trim and yield loss. Those last two buckets are where the money you can control sits. The industry name for it is usage variance:
(what you used vs. what you should have used for what you sold)
Most groups already track this as the gap between actual and theoretical food cost, often shortened to AvT. What changes in a year like 2026 is the price attached to that gap.
What overprep costs when prices rise
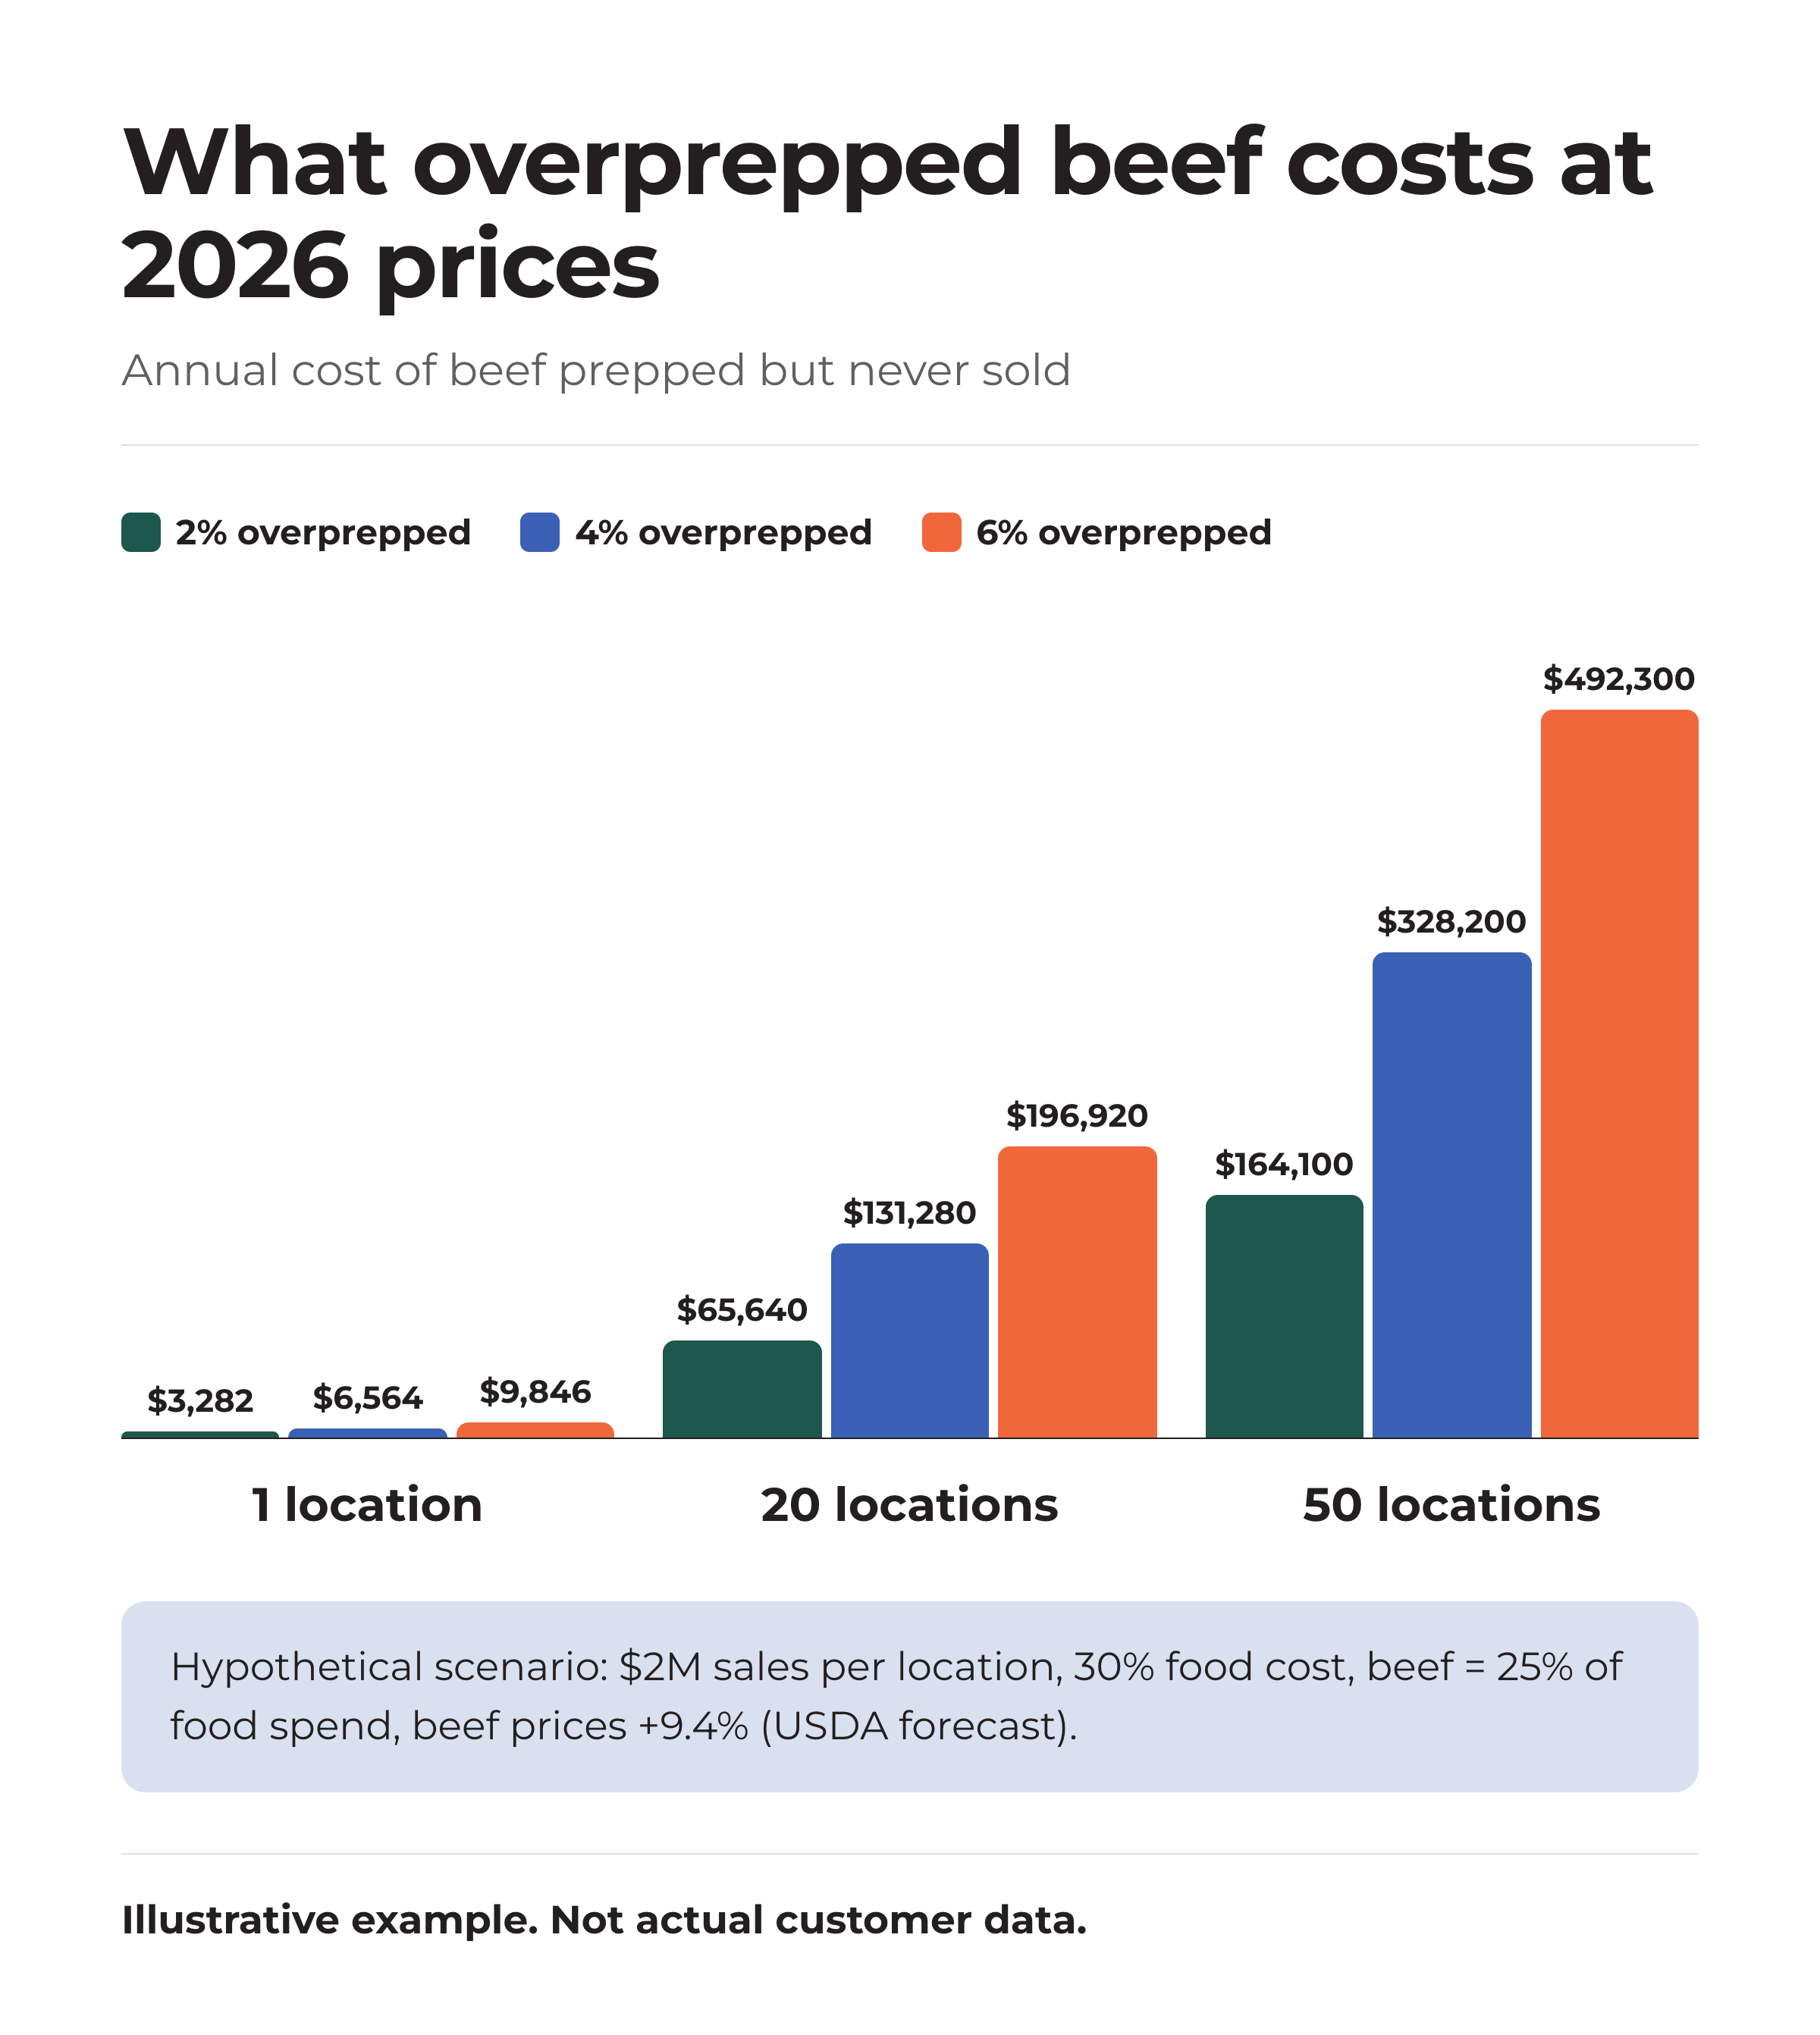
Let’s run the numbers on a made-up location. These assumptions are for illustration only. They aren’t industry benchmarks.
- Annual sales per location: $2,000,000
- Food cost: 30%, or $600,000 a year in food purchases
- Beef: 25% of food spend, or $150,000 a year
- Beef prepped and never sold: 4% of beef purchased
One note on the price: we used USDA’s retail beef forecast of 9.4%. Restaurants buy at wholesale, which USDA forecasts at 8.5% with a much wider range (3% to 15%), so your own invoices could move less or more than this example.
At last year’s prices, that 4% costs $6,000 per location per year. If beef rises 9.4% and nothing else changes, the same amount of overprep now costs $6,564. Nobody did anything differently. The waste simply got more expensive.
The price went up. The behavior didn’t. That gap is the bill.
There are two ways to look at it.
First, the beef price increase itself costs this hypothetical location $14,100 a year ($150,000 × 9.4%). Cutting beef overprep from 4% to 2% saves $3,282. That alone recovers about 23% of the price increase, without touching the menu.
Second, look at all food rather than one protein. One percentage point of overproduction across $600,000 in annual food purchases is $6,000 per location. Across 20 locations that’s $120,000 a year. If the group runs a 5% profit margin, replacing that $120,000 through new sales would take $2.4 million in additional revenue.
That’s why I’d put usage at the top of the food cost list this year. It’s the one lever that doesn’t ask guests to pay more.
Where to look first: a cost-weighted watchlist
You don’t need to watch every item equally. Here’s a simple way to rank them:
For most US menus in 2026, that puts these at the top:
- Beef. Large share of spend, the biggest forecast increase in the table, and the widest range of outcomes.
- Fresh produce. Up 5.7% at retail, and short shelf life means overprep turns into waste within a day or two.
- Anything with a long prep chain. An item that’s trimmed, marinated, cooked and portioned ahead of service carries labor as well as ingredient cost, so each wasted unit costs more than its invoice price.
Two more items belong on the list even though their 2026 retail numbers look calm, because the pressure is still upstream:
Early warning: wheat
USDA forecasts farm-level wheat prices up 18.3% in 2026, while retail cereal and bakery prices are forecast to grow more slowly than their historical average. USDA notes that consumer prices typically lag producer prices, because food passes through several processing stages. Expect bread, buns and dough to follow before invoices fully reflect it.
Early warning: fresh vegetables
Farm-level vegetable prices are forecast up 16.0% for the year, despite falling sharply in July and August.
Eggs are the opposite case. With prices forecast down 29.4%, the risk is overcorrecting: building new menu items or specials around cheap eggs at the exact moment the market is most volatile.
The same food cost problem looks different from each seat
In a multi-unit group, doing something about food cost usually means getting a few people to agree. Each of them tends to ask a different question first.
From finance: what is the dollar value of one point?
Use your own numbers. Take annual food purchases per location, multiply by 1%, and multiply by your location count. That’s the value of one point of usage variance. Compare it to what the same gain would cost through pricing or new sales. If you’re building an internal case for a tool or a process change, it’s worth reading how to build a defensible ROI case before you sign anything.
From operations: will this slow the kitchen down?
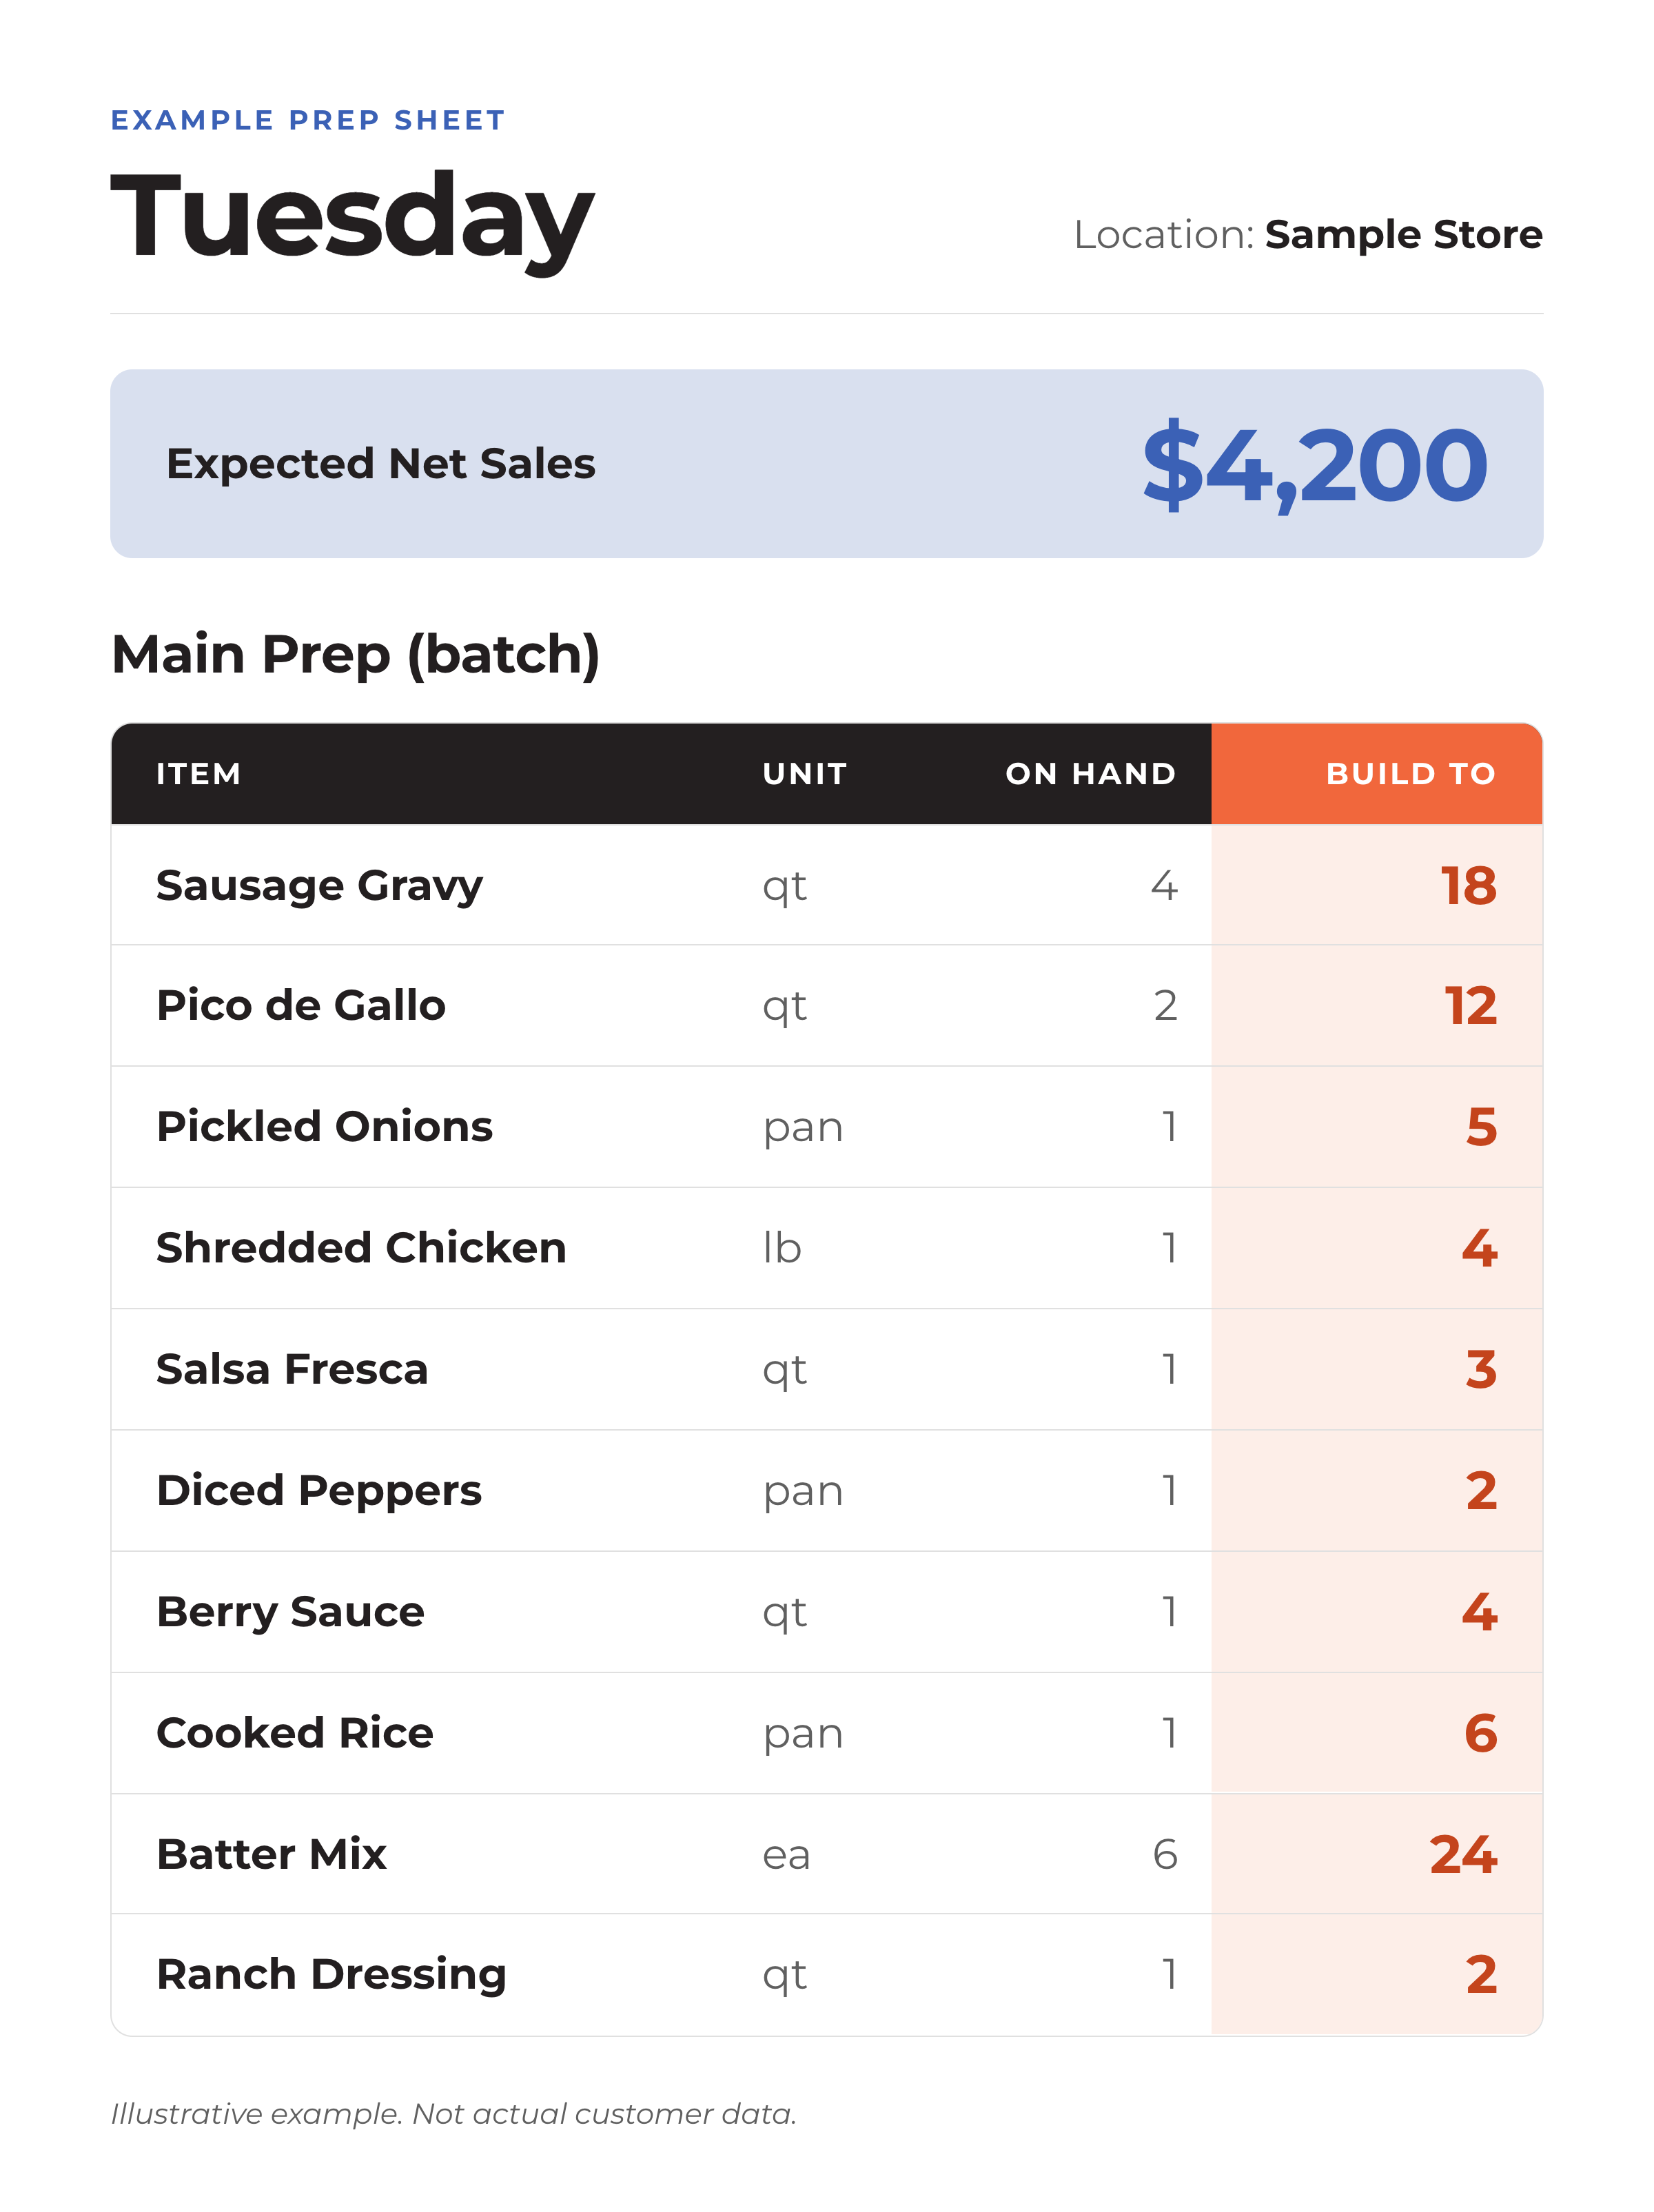
It shouldn’t. A good prep sheet takes decisions off a manager’s plate at 6am instead of adding paperwork. A prep sheet that tells a manager how many pans of each item to make, based on expected demand, is faster to follow than one built on gut feel or a fixed par. The problem with fixed pars is that they are set for an average day, which is why par levels fail on the days that matter most.
From IT and data: what does this actually require?
Mostly what you already have. Item-level sales from the POS, recipe definitions, and a record of what was prepped. You don’t need to count every shelf every day to forecast prep. We’ve written about whether inventory counts are required, and the short answer is that sales history does most of the work.
From franchise leadership: can we compare units on this?
Only if every unit defines usage the same way. Comparing food cost percentages across locations hides the cause. Comparing usage variance by item shows which locations are overprepping beef and which are running out of it.
How to tell if it’s working
Track three numbers by item and by location, weekly:
- Usage variance in dollars, weighted by current unit price. A 3% miss on beef should count for more than a 3% miss on onions.
- Waste in dollars for your top five cost-weighted items. That’s usually where the money is.
- Stockouts and the time they happened. Cutting overprep is only a win if you aren’t running out instead. A forecast that reduces waste by creating 86s at 7pm hasn’t saved anything.
For a real-world example, read how one bagel shop cut $4K a month by forecasting what to make each day.
If your team wants a shared vocabulary for these measures, our demand forecasting terms guide defines each one. For items without a sales history, such as a new beef special added in response to pricing, see how to forecast new menu items.
Frequently asked questions
How much will restaurant food prices rise in 2026?
USDA forecasts food-away-from-home prices, which cover restaurants and other foodservice, to rise 3.5% in 2026, with a forecast range of 3.3% to 3.8%. That matches the 20-year historical average.
Why are beef prices so high in 2026?
USDA reports that federally inspected beef production is running about 2% below last year and is expected to stay below year-ago levels through the end of 2026. It forecasts retail beef and veal prices up 9.4% for the year.
Which restaurant ingredients are getting cheaper in 2026?
Eggs are forecast down 29.4% in 2026 after several years of avian flu disruptions. Dairy is forecast roughly flat at 0.1%, and poultry and pork are forecast up only 1.0% and 1.2%.
What is a good food cost percentage for a restaurant?
It depends on the format and menu, and published benchmarks vary widely. A more useful target is your own trend: whether actual food cost is moving closer to theoretical food cost, item by item, week over week.
How can restaurants lower food costs without raising menu prices?
Reduce usage variance: prep closer to expected demand, prioritize the most expensive items first, and track waste and stockouts together so savings on one side aren’t lost on the other.
The bottom line
Nobody in a restaurant can change what cattle cost this year. What every kitchen can change is how much of that beef gets prepped and never sold. When ingredient prices rise unevenly, the value of getting usage right rises with them, and for a multi-unit group it adds up faster than most price increases can.
This is the work we spend our days on at ClearCOGS: turning sales history into a daily prep plan for each location, so the amount made matches the amount likely to sell, item by item.
Run the math on your locations
Take your annual food purchases, multiply by 1%, and multiply by your location count. That’s what one point of usage is worth to you. If you want help turning that number into a daily prep plan, we’re happy to walk through it with you.
About the author
Matt Wampler is the CEO and Co-Founder of ClearCOGS. Before founding the company, he ran Jimmy John’s franchise restaurants in the Washington, D.C. suburbs, where daily decisions about how much bread to bake set the margin. He hosts the Restaurant AI Podcast.
Disclosure and methodology
ClearCOGS sells prep forecasting software, so we have a commercial interest in operators paying attention to usage. Every price forecast in this article comes from the USDA Economic Research Service Food Price Outlook, updated September 25, 2026, and includes the forecast range USDA published. Industry sales and profitability figures come from the National Restaurant Association, July 2026. The worked example uses hypothetical assumptions that are labeled as such; substitute your own sales, food cost and overproduction figures. Last reviewed: October 2026.
Sources
- U.S. Department of Agriculture, Economic Research Service. Food Price Outlook: Summary Findings. Updated September 25, 2026. ers.usda.gov
- National Restaurant Association. Restaurants remain resilient despite challenging business conditions. July 22, 2026. restaurant.org


