


By Matt Wampler, CEO of ClearCOGS
Quick answer: A manager should override a recommended prep or order quantity only when they know something the forecast can’t: a catering order, a local event, a short delivery, or carryover on the shelf. Changes based on a feeling usually make things worse. Research on managers adjusting statistical forecasts found their changes were more often harmful than helpful, and that accuracy improved once they got feedback on their adjustments. The fix isn’t to lock the number. It’s to make every override carry a reason, so you can see which ones were right.
Why do restaurants with good systems still run out?
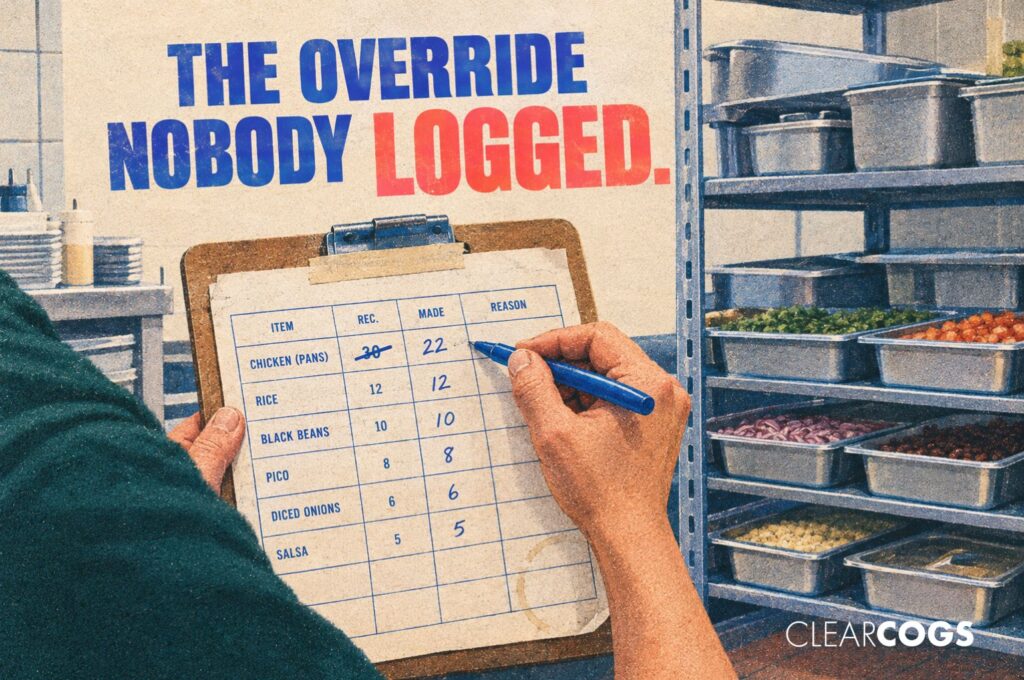
The prep sheet says 30. The manager looks at it, thinks about last Tuesday, and makes 22.
At 12:40, they’re out.
Every operator has lived some version of that day. What’s surprising is how often it happens in groups that run their numbers well. One large operator reports running 50 to 60 basis points off theoretical food cost, which is excellent by any standard, and still traces almost all of its stockouts back to two things: typing errors on orders, and managers swapping the recommended number for their own.
That second one is worth slowing down on, because it’s the more human problem. Nobody overrides the forecast to cause a stockout. They override it because they believe they know better. Sometimes they do.
This isn’t a knock on managers. A good forecast has seen every sale at that location for the last two years. A manager at 6am has seen last week and a feeling about today. Both are useful. Only one of them is usually written down.
Why a stockout feels cheaper than waste
Here’s the part that explains almost everything.
Waste is visible. It’s in the bin, on the waste sheet, in front of the manager at close. Nobody wants to be the one who threw out four pans of product, so cutting the number feels responsible.
A stockout is invisible. The guest who wanted the item orders something else, or leaves. There’s no line on the P&L for the sale that didn’t happen. And because the product was never made, it never shows up in food cost variance either. Your actual vs theoretical numbers can look perfect while you’re quietly losing sales.
You can see what you throw away. You can’t see who walked away.
So the incentive tilts one direction. Managers get feedback every night on waste and almost never on lost sales. Over time, that pushes the number down, one reasonable-looking cut at a time.
What the research says about overriding forecasts
This isn’t unique to restaurants. Researchers at Erasmus University Rotterdam studied it in a setting where it could be measured precisely: 21 managers in 21 countries who received sales forecasts from a statistical program and were allowed to adjust them before they became final (Legerstee and Franses, Erasmus University).
What they found
Before any feedback, the managers left the system’s forecast untouched in fewer than 1 in 300 cases. Their own earlier analysis had found that the managers deviated too much from the model, gave it too little weight, and ended up equally accurate at best and often much less accurate. After the managers were shown how they had been adjusting and how accurate those adjustments were, they changed the number less often, made smaller changes relative to the forecast, and went from being less accurate than the model on average to slightly more accurate.
Two details from the study matter for a kitchen.
First, the managers who made the biggest gains were the ones who shrank their adjustments the most. Second, the researchers found that accuracy also improved when managers’ adjustments became more varied, and concluded that the managers had gotten better at identifying when and how to adjust, instead of adjusting carelessly. That’s exactly the line we want: change the number when you know something, leave it alone when you don’t.
A fair caveat: this was pharmaceutical sales forecasting, done monthly, with no control group and three months of data after the feedback session. Restaurant prep is faster and messier. But the behavior it describes is the same one every operator recognizes, and the fix it points to is simple: show people what their overrides actually did.
What does one override actually cost?
Let’s put numbers on that 30-versus-22 decision. This is a hypothetical example to show the math.
- The item: pans of prepped chicken
- Each pan serves 10 orders at $12 each
- Ingredient cost: $30 per pan
- Recommended: 30 pans. The manager makes 22, so 8 pans short.
- If the forecast was right and the kitchen runs out, assume half of the affected guests substitute and half are lost.
Hypothetical example. Substitute your own item, price, cost and substitution rate.
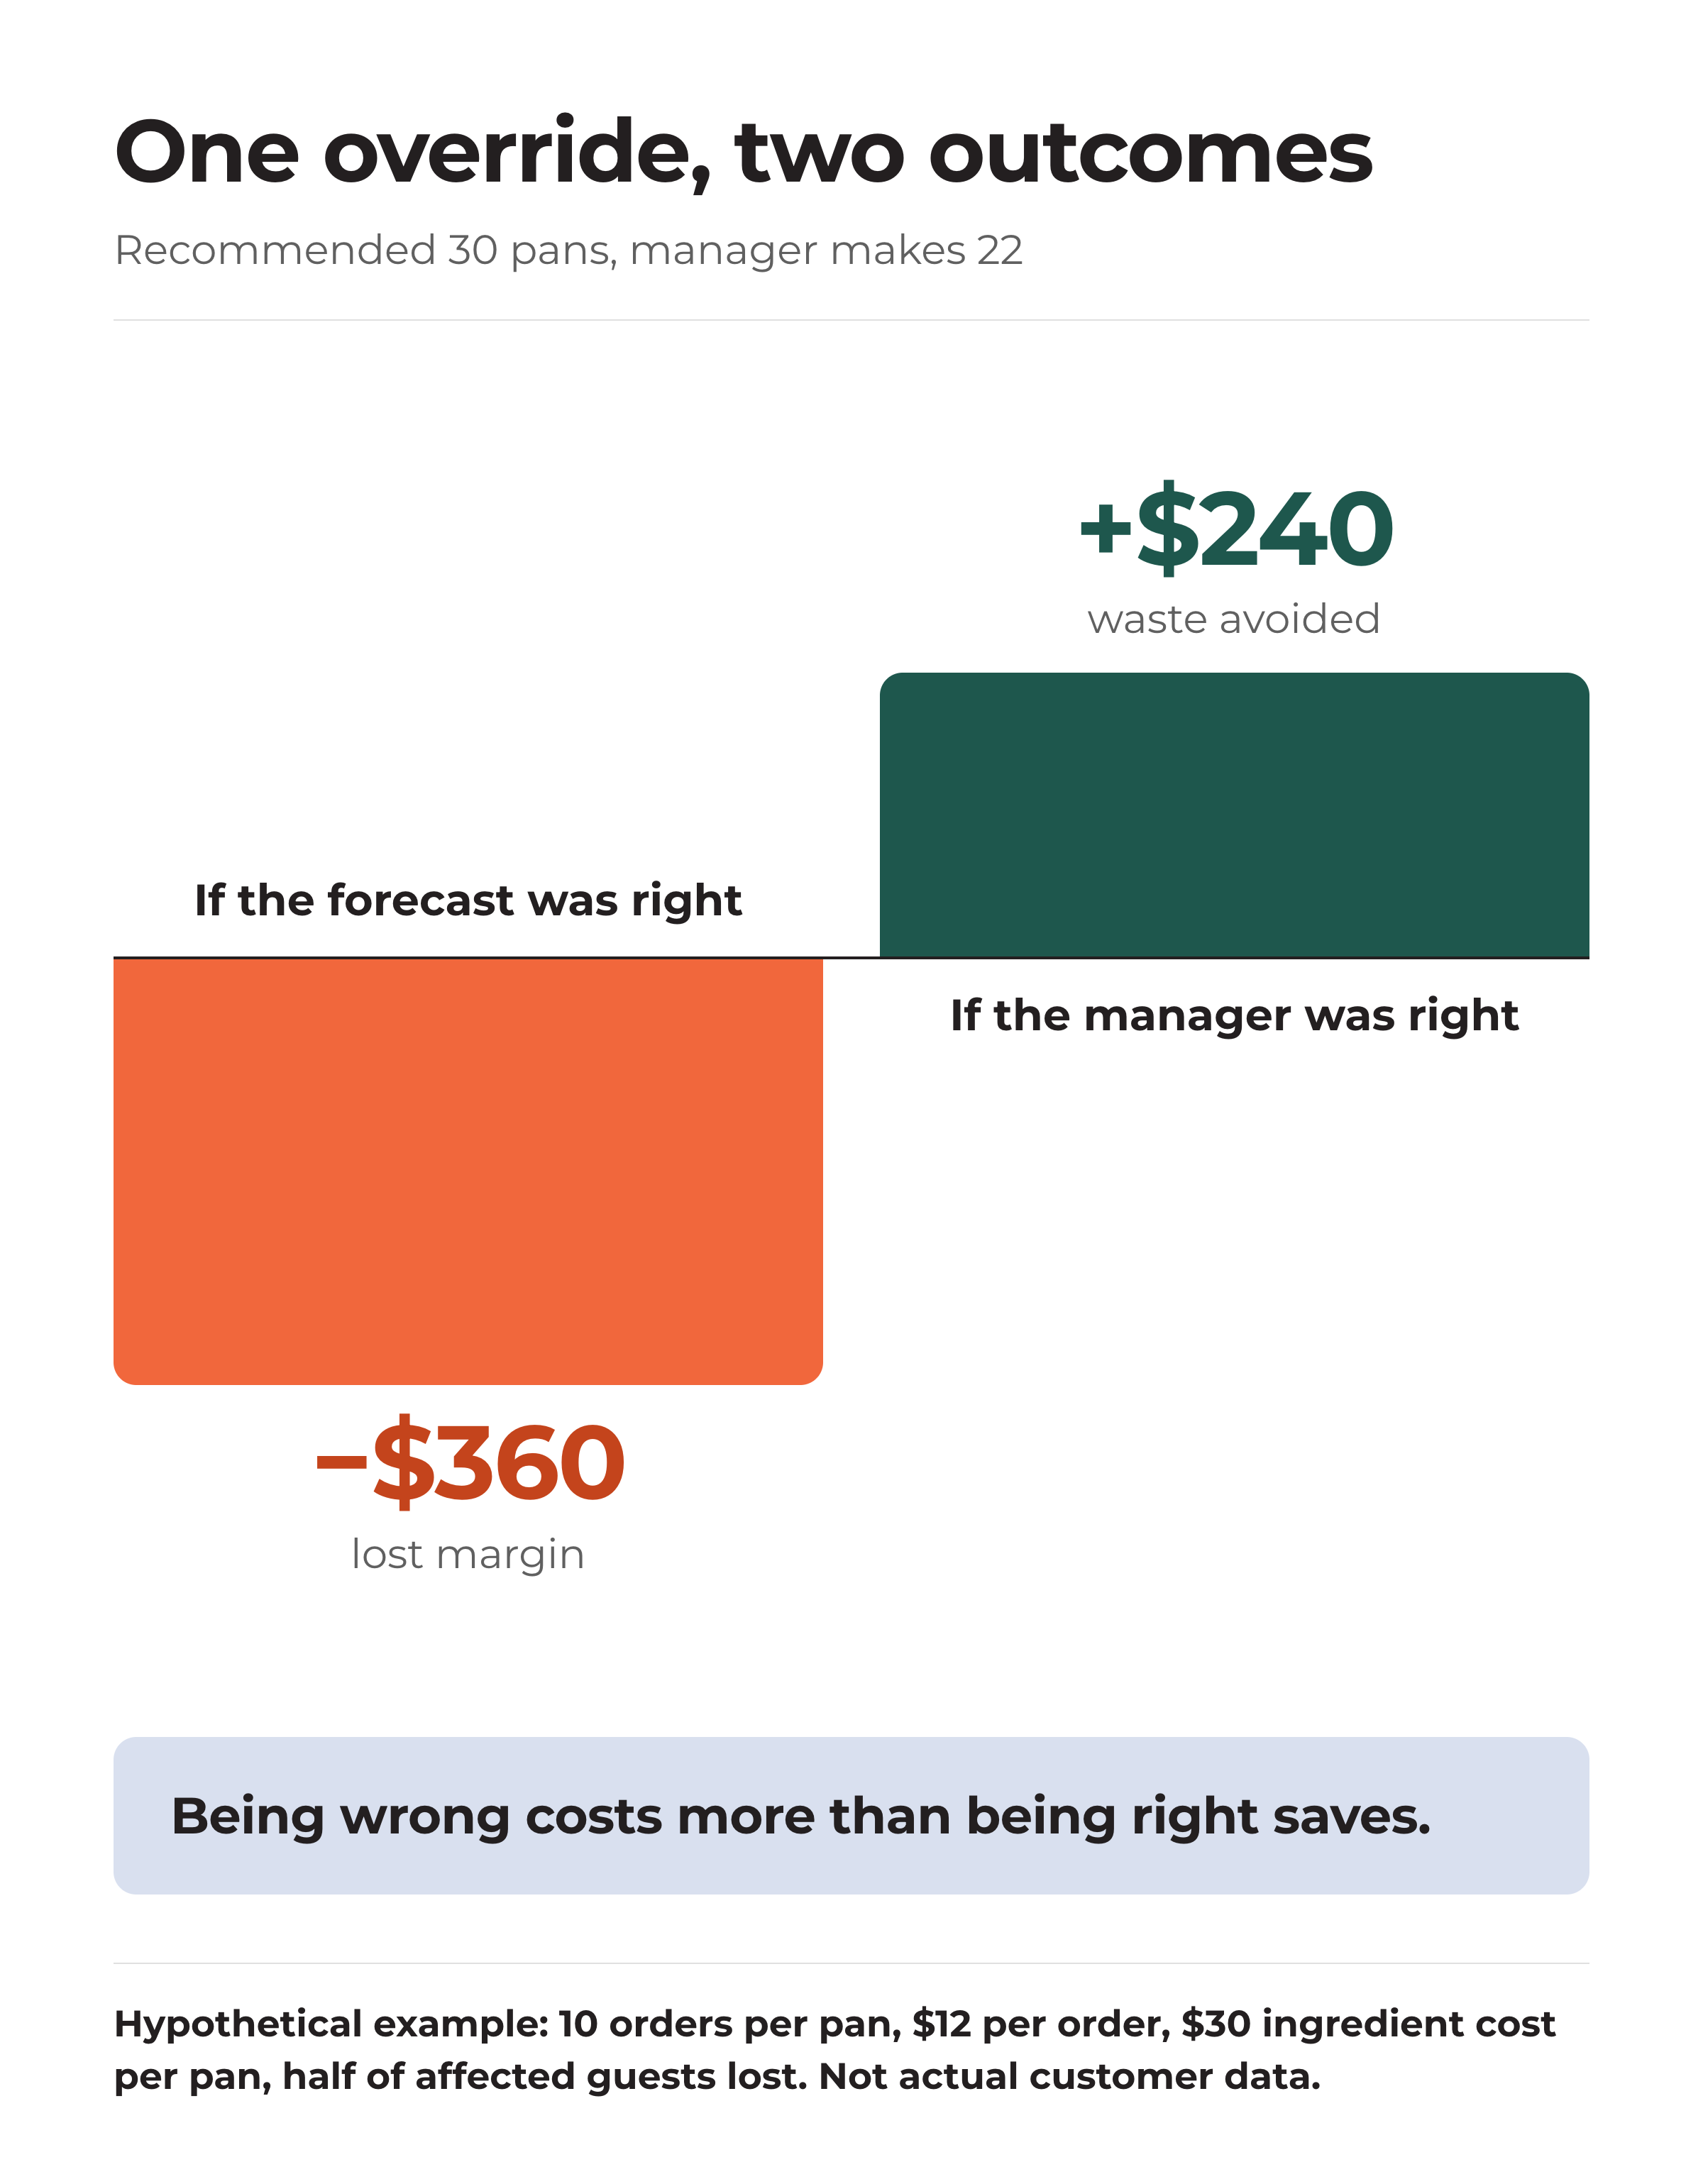
Notice the two outcomes aren’t the same size. Being wrong costs more than being right saves. That’s the whole game.
The 60% rule: how often does a gut call need to be right?
If being wrong costs $360 and being right saves $240, you can work out how often a manager’s instinct has to be correct just to break even:
$360 ÷ ($360 + $240) = 60%
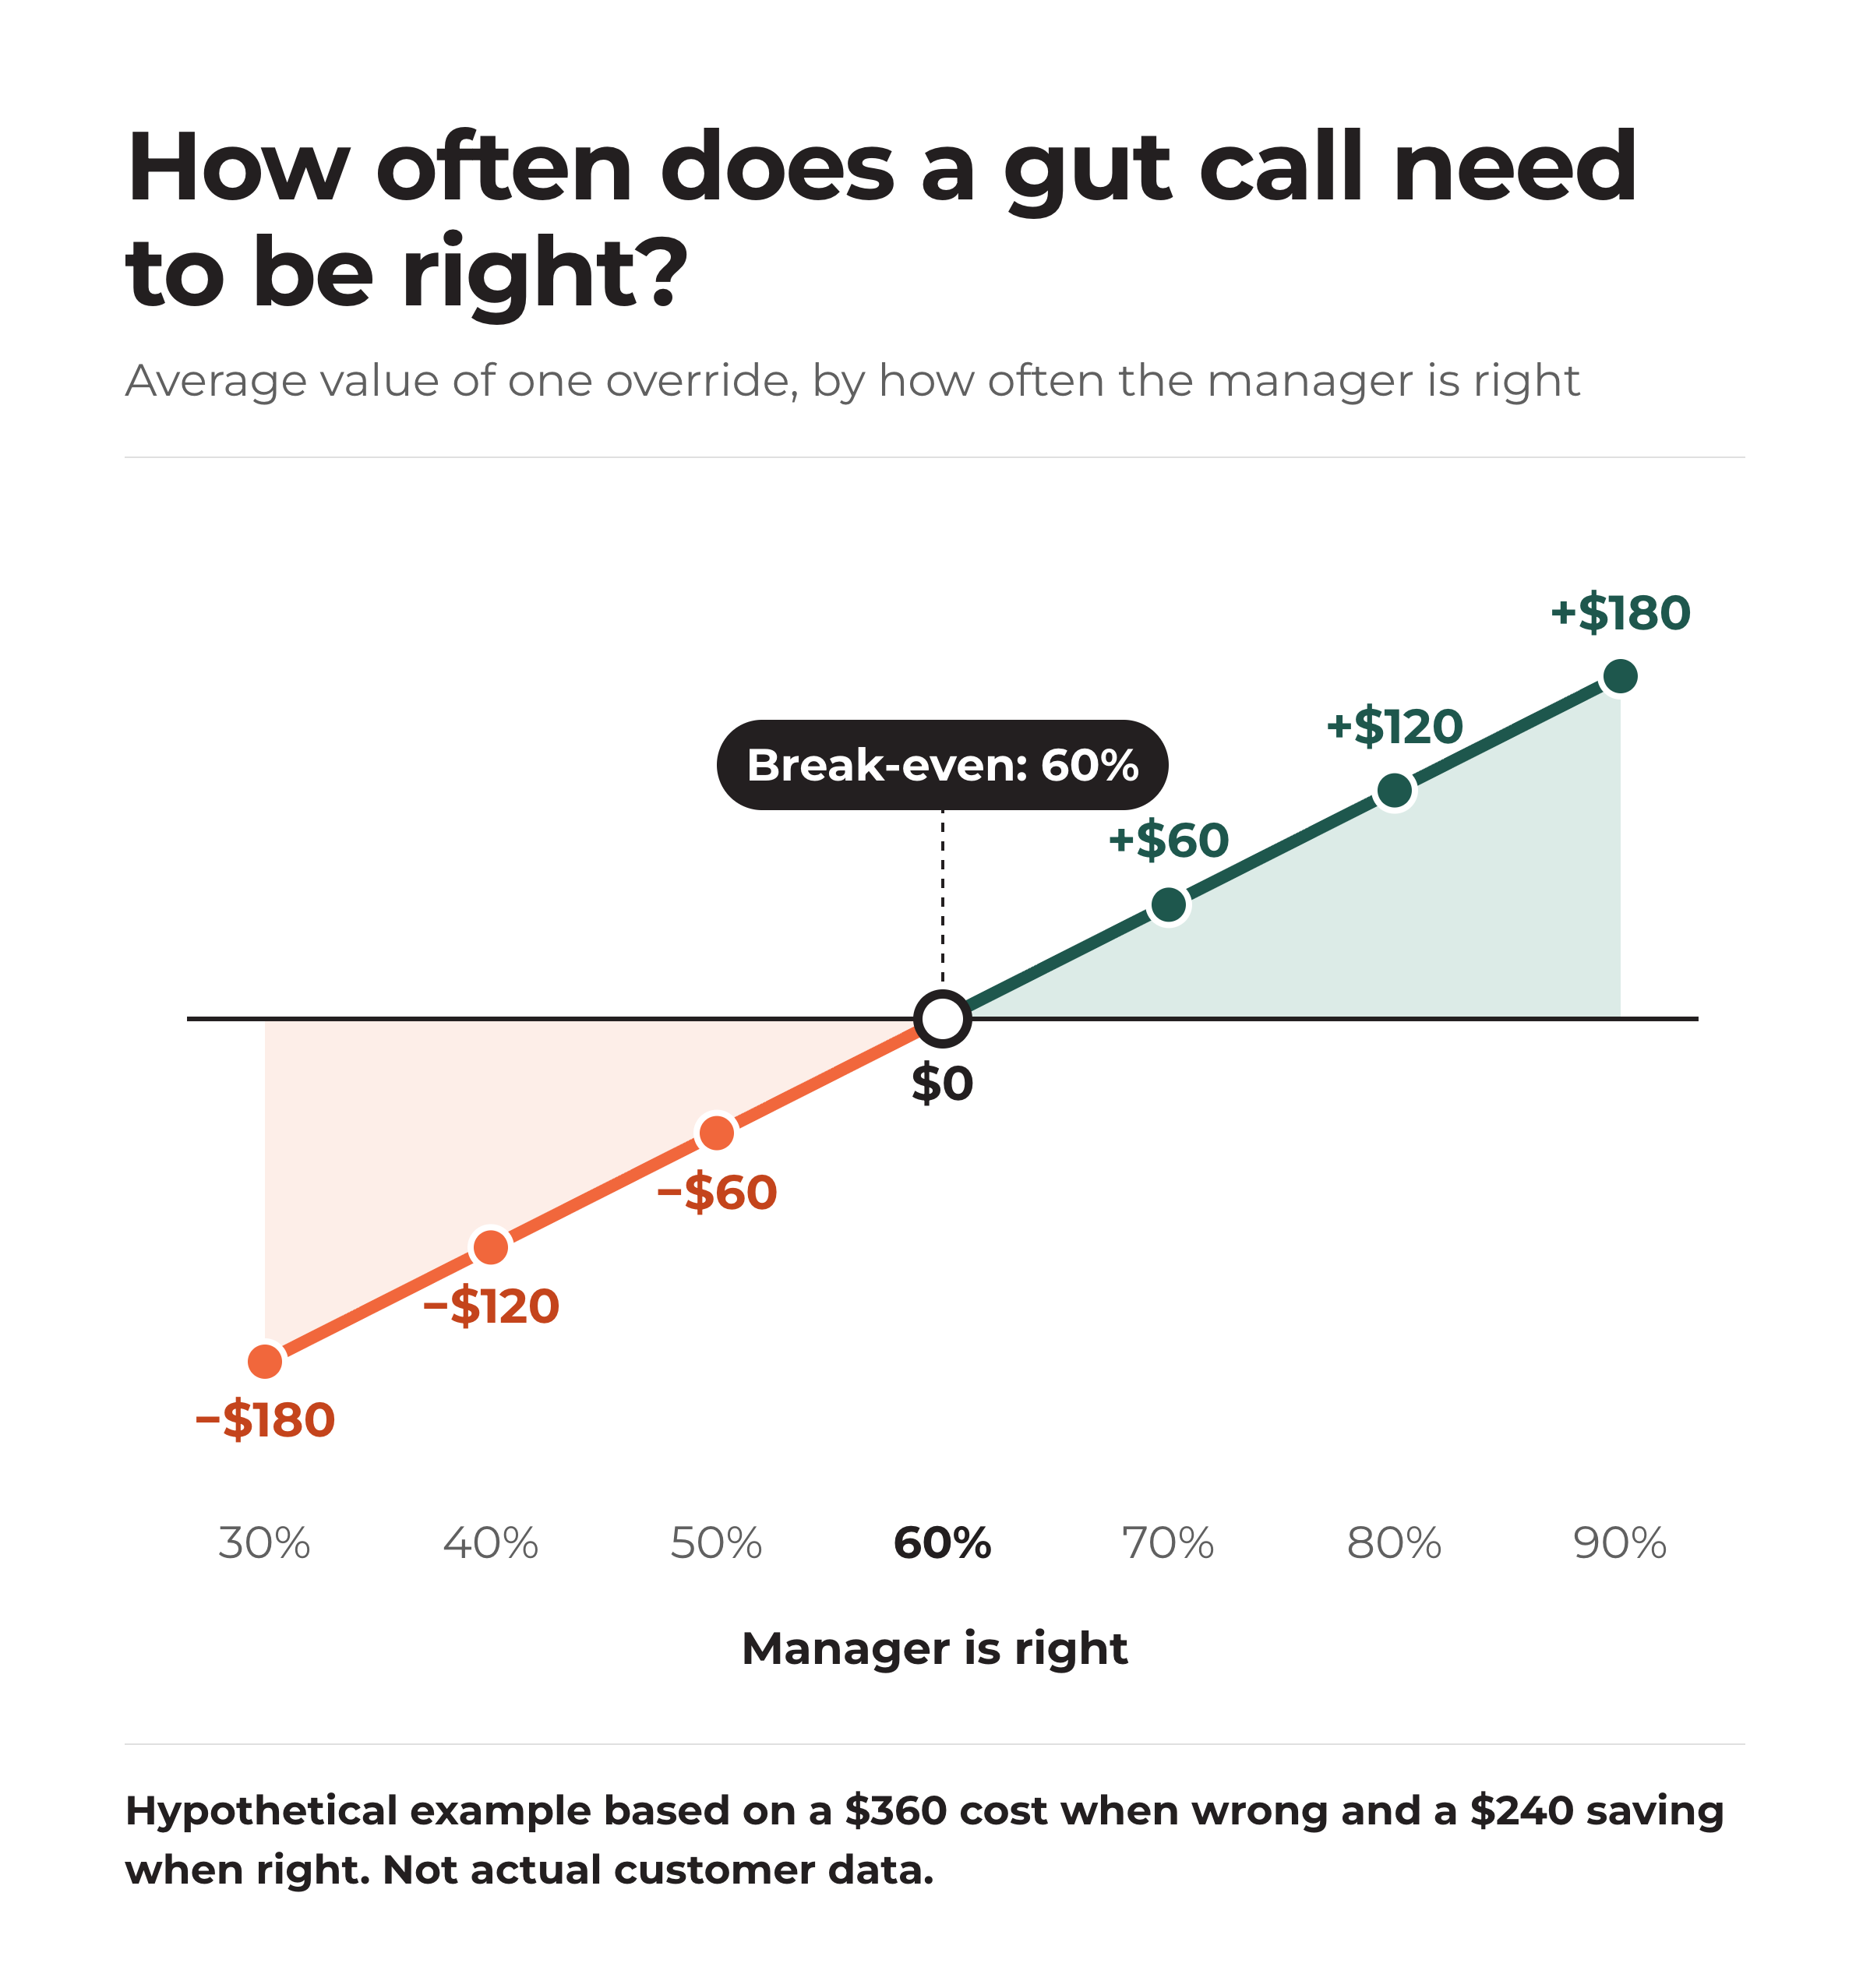
Now scale it. Say overrides like this happen twice a week per location across 20 locations, and managers are right half the time. Each override loses $60 on average (half the time −$360, half the time +$240). That’s about 2,080 overrides a year and roughly $125,000 in lost margin, none of which appears in your food cost report.
Flip it around, though. If a manager is right 70% of the time, each override is worth about +$60. That’s why you don’t want to take the pen away. Some of your managers are better than the forecast on some days. You just can’t tell which ones yet.
What makes an override legitimate?
The test is simple: does the manager know something the forecast couldn’t have known? Most good overrides fall into a few buckets, and one bucket covers almost everything else.
Known demand
A catering order, a booked group, a local event the forecast hasn’t seen before.
Supply problem
A short delivery or product that didn’t meet quality standards.
Carryover
Usable product already on hand that the system doesn’t know about.
Staffing
Not enough hands to prep it all in time, so the plan has to change.
Just a feeling
No specific reason. Sometimes right. Worth tracking, because this is where the 60% rule bites.
The point of the last card isn’t to shame anyone. It’s to make the feeling visible. A manager who picks “just a feeling” and turns out right 75% of the time has a real skill you want to learn from. One who’s right 40% of the time is costing you money and doesn’t know it.
How do you tell a good override from a bad one?
You can’t, unless you write down the reason at the moment it happens. After the fact, a smart override and a lucky one look identical. So does a bad one and an unlucky one.
Here’s a simple way to start:
- Ask for a reason, every time. One tap from a short list like the cards above. No essay.
- Record what happened. Did the item run out, and when? How much was left at close?
- Review weekly by manager and by reason. Which reasons beat the forecast? Which ones didn’t?
- Share it back with the managers. That’s the feedback step the research found made the difference.
Locking the field backfires. It makes your best managers resent the system and your worst ones work around it. Logging the reason turns every override into either a lesson for the forecast or a habit you can coach.
The same override looks different from each seat
In a multi-unit group, deciding what to do about overrides involves more than one person. Each tends to start with a different question.
From finance: why doesn’t this show up in our numbers?
Because the product was never made. Underprep doesn’t create variance. It creates missing sales, and missing sales don’t have a line item. If your actual vs theoretical food cost is tight but stockouts keep coming up in guest complaints or in the kitchen, overrides are the first place to look. The ledger above gives you a way to put a dollar figure on it.
From operations: are we taking judgment away from managers?
No. The goal is to make good judgment count. Managers are making a call under time pressure at 6am, often with a short-staffed crew. A reason code takes a few seconds and protects them: when they’re right, there’s a record of it. When the forecast is better, it’s better on the managers’ terms, with their own data.
From IT and data: what does this require?
Less than it sounds. You need the recommended number, the number the manager actually used, a reason, and a record of stockouts and leftovers. A good system can also catch the other common cause, typing errors, at the moment of entry, by comparing a count or an order against what was counted last time, what was ordered and what was used, and asking the person to double-check when it doesn’t fit.
From franchise leadership: should we set an override policy?
A light one. Don’t ban overrides. Require a reason, review them on a regular schedule, and share the results across locations. The interesting finding is usually that a few managers are consistently better than the forecast on certain items. That knowledge belongs to the whole system, and right now it lives in a few people’s heads.
How to tell if it’s working
Track these by location and by item, weekly:
- Override rate: how often the recommended number gets changed.
- Override hit rate by reason: how often each reason turned out to be right.
- Stockouts, with times: an override that saves waste by creating a 12:40 stockout didn’t save anything.
If you want shared definitions for these measures, our demand forecasting terms guide covers them. For why fixed numbers struggle on unusual days, see why par levels fail. If you’re wondering whether you need perfect counts first, we’ve written about whether inventory counts are required. And with beef and produce prices up this year, the cost of getting it wrong is rising too, as we covered in what’s happening with 2026 food costs.
Frequently asked questions
When should a restaurant manager override the forecast?
When they know something the forecast can’t: a catering order or booked group, a local event, a short or poor-quality delivery, usable carryover on hand, or a staffing limit. Overrides based only on a feeling should be tracked, because they’re right less often than they feel.
Do manual adjustments make forecasts more accurate?
Often not. Research at one large company found that managers’ adjusted forecasts were equally accurate at best and often less accurate than the statistical model. After 21 of those managers received feedback on their adjustments, they adjusted less, made smaller changes, and became slightly more accurate than the model on average.
Why do restaurants with low food cost variance still have stockouts?
Because underprep doesn’t show up as variance. If an item was never made, there’s nothing to compare against theoretical usage. The cost shows up as lost sales, which most restaurant reports don’t capture.
Should we lock managers out of changing the prep number?
Usually no. Some overrides are better than the forecast. Requiring a quick reason and reviewing the results keeps the good overrides and exposes the costly ones.
How often does a manager’s override need to be right to be worth it?
It depends on the item. Divide what a stockout costs by the total of that cost plus what over-prepping wastes. In our hypothetical example, the break-even is 60%, so a manager has to be right six times out of ten just to break even.
What should we record when someone changes the number?
The recommended quantity, the quantity actually used, the reason, and the outcome: whether the item ran out and when, and how much was left at close.
The bottom line
Every override is a small bet that the person in the kitchen knows something the forecast doesn’t. Some of those bets are good. Most of them are invisible, because nobody writes down why they were made or how they turned out. Start logging the reason, and within a few weeks you’ll know which of your managers are beating the forecast, and on which items.
This is the work we spend our days on at ClearCOGS: turning sales history into a daily prep plan for each location, so the amount made matches the amount likely to sell, item by item.
Try the 60% rule on one item
Pick your most overridden item. Work out what a stockout costs and what over-prepping wastes, and find your break-even rate. Then ask how often your managers’ changes actually beat it. If you’d like help setting up the tracking, we’re happy to walk through it with you.
About the author
Matt Wampler is the CEO and Co-Founder of ClearCOGS. Before founding the company, he ran Jimmy John’s franchise restaurants in the Washington, D.C. suburbs, where every morning started with deciding how much to prep. He hosts the Restaurant AI Podcast.
Disclosure and methodology
ClearCOGS sells prep forecasting software, so we have a commercial interest in how operators use forecasts. Research findings come from Legerstee and Franses, Erasmus University Rotterdam (2011), which studied 21 managers adjusting monthly pharmaceutical sales forecasts, with three months of data after a feedback session and no control group; restaurant results may differ. The operator detail is shared anonymously and reported by the operator. The override ledger and the 60% break-even use hypothetical assumptions that are labeled as such; substitute your own prices, costs and substitution rates. Last reviewed: October 2026.
Sources
- Legerstee, Rianne, and Franses, Philip Hans. Do experts’ SKU forecasts improve after feedback? Econometric Institute Report 2011-31, Erasmus University Rotterdam. September 22, 2011. repub.eur.nl