



By Matt Wampler, CEO of ClearCOGS
To forecast restaurant sales for the holiday season, stop treating November and December as one busy block. Nationally, December restaurant sales per day run about even with November and below August, so the holiday problem is swings inside the month rather than more volume overall. The seven checks below walk through how to build the forecast week by week, from the Wednesday before Thanksgiving through New Year’s Day, using your own data and a few numbers you can verify.
The short version
Nationally, December sales per day land about where November does, with closed days, party weeks and one huge night averaging out. Forecast the six holiday windows separately, check last year’s weather and calendar before copying it, plan for closures and gift-card redemption as inputs, and build prep from guest and item counts rather than dollars. Then set a review cadence of twice a week until January 3.
Are restaurants busier in December?
Before the checklist, one number worth guessing at.
Guess first: in December 2025, how did U.S. restaurant sales per day compare with November?
Tap to see the answer
About 0.4% lower. Census Bureau data for food services and drinking places, not seasonally adjusted, put November 2025 at $84.2 billion over 30 days and December at $86.6 billion over 31 days. Per day, that is $2.81 billion in November and $2.79 billion in December. December was also 5.1% below August per day. In 2024 the pattern was the same: December per day ran 0.7% below November and 2.8% below August. Then January 2026 dropped 7.4% from December.
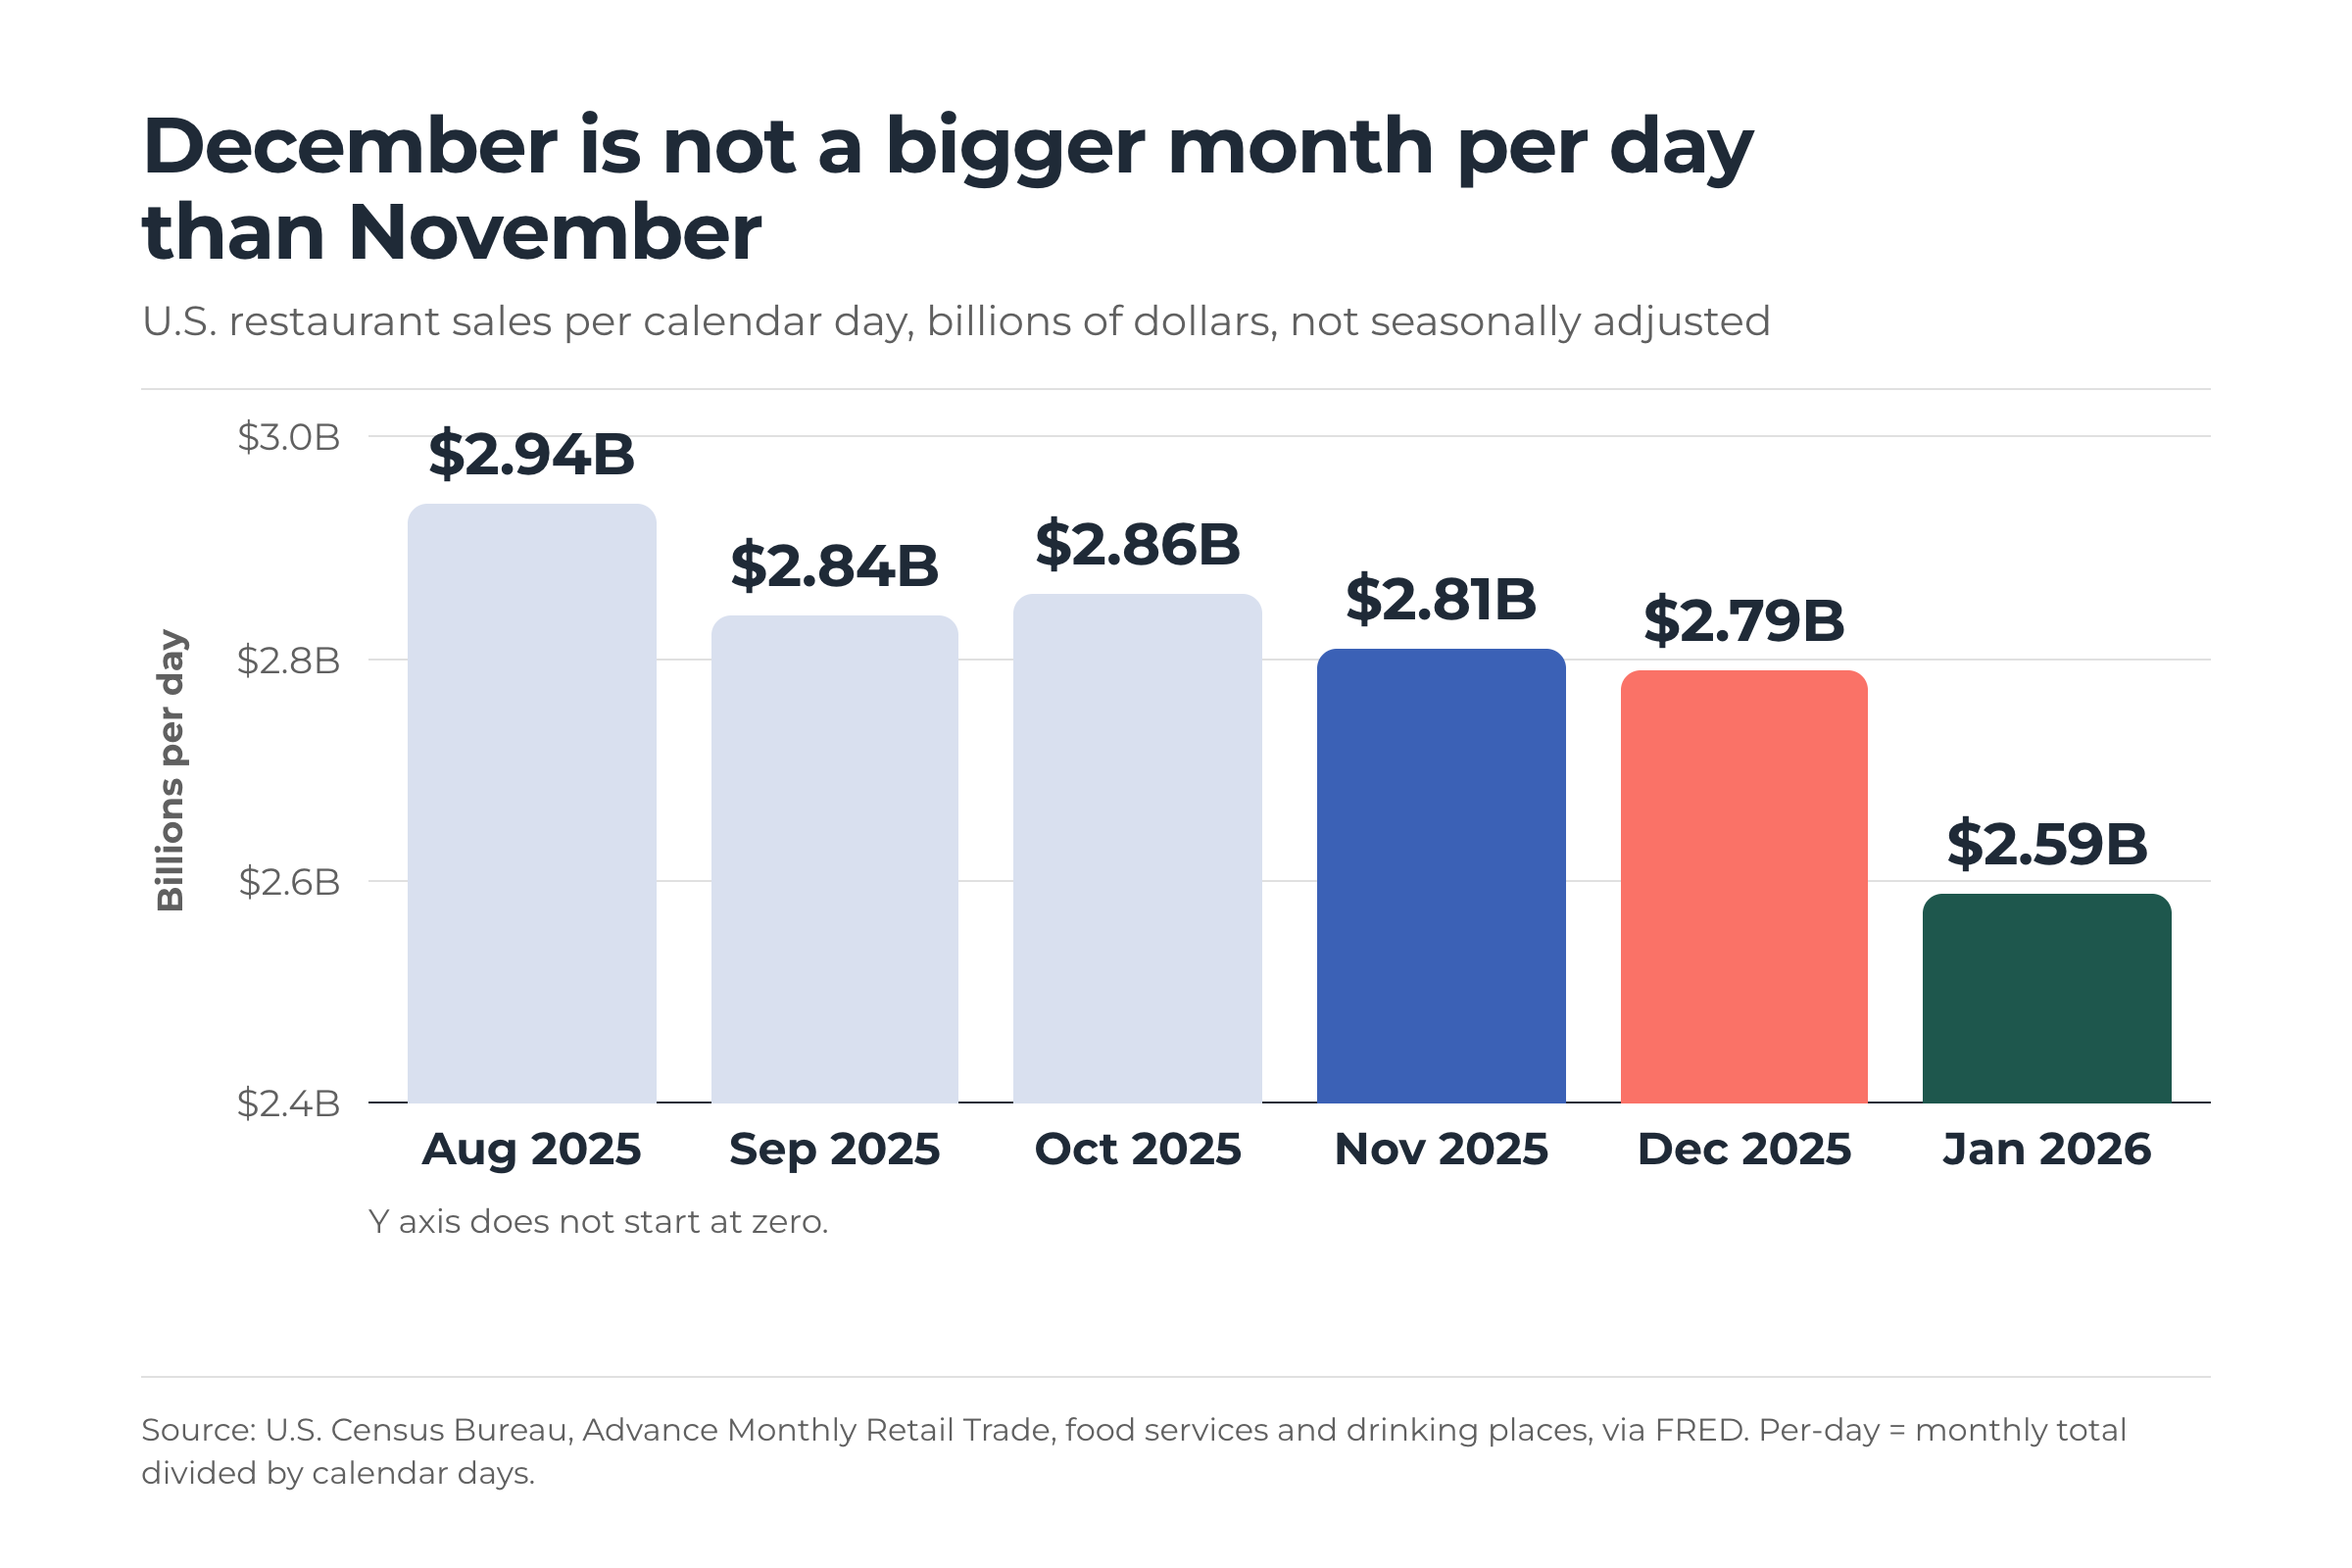
Sales per calendar day, U.S. food services and drinking places, not seasonally adjusted. Source: U.S. Census Bureau via FRED.
That surprises many operators, and it should change how you plan. If your December plan starts with “add 15% because holidays,” you are planning for volume the national data doesn’t show. What the data does show is a month with closed days, party weeks, a dead week, and one very big night, all averaging out to normal. The forecast has to be built at the level where those differences live.
How do you forecast restaurant sales for the holiday season? Seven checks
1. Split the season into six windows
One December forecast is useless because December is six different demand patterns stacked together. Tap each one.
Window 1: Thanksgiving week
The Wednesday before is often one of the biggest bar and casual dining nights of the year. Thursday is closed for most, or a single fixed-menu service. Friday and Saturday carry travel and leftover-fatigue traffic. Forecast the four days as four different days, from last year’s four days.
Window 2: The first two weeks of December
Office parties and large groups, mostly Tuesday to Thursday, mostly booked in advance. Your reservation and catering books are a better forecast input than last year’s walk-in sales. Lunch is often soft while dinner is heavy.
Window 3: The weekend before Christmas
Shopping traffic, families in town, and the last big group dinners. Weather matters more than usual, because a storm this weekend removes sales that don’t come back later.
Window 4: Christmas Eve and Christmas Day
Closed or special-menu days for most full-service concepts. The forecasting job here is the days before: stop prep early enough that a two-day closure doesn’t leave product aging in the walk-in.
Window 5: The dead week
December 26 to 30. Offices empty, schools out, patterns scrambled. Weekday lunch often falls hard while family dinner and travel traffic rise. Gift cards start showing up at the register. Don’t forecast it from the party weeks.
Window 6: New Year’s Eve and the first days of January
One huge dinner night with a long tail into the early hours, then a sharp drop. January 2026 restaurant sales were 7.4% below December. Prep for the 31st as its own event and cut hard on the 1st and 2nd.
2. Pull last year by window, then check the calendar shift
Pull last year’s sales by day for each of the six windows, including guest counts and item mix as well as dollars. Then line up the calendar. Thanksgiving moves between November 22 and 28, so the party weeks can be one week longer or shorter from one year to the next. Christmas Eve on a Saturday is a different animal from Christmas Eve on a Wednesday. A day-of-week shift can swing a single day by more than any trend you’d apply on top of it.
3. Check last year’s weather before you copy it
Pull the weather for each of last year’s holiday days in each market. A snowstorm on the weekend before Christmas in one region means last year’s number for that weekend is low for a reason that won’t repeat, and a mild year means the opposite. This is where multi-region groups go wrong with a single systemwide trend: the weather adjustment has to be local. The finance team’s version of this check is simple: any day last year that was more than 20% off its neighbors needs a reason written next to it before it’s used as a base.
4. Treat closures and hours as forecast inputs
List every location’s actual hours for every day from Thanksgiving to January 2. Closed days are obvious. The less obvious inputs are early closes on Christmas Eve, late opens on January 1, and the private-event buyouts that remove a dining room for a night. Each one changes the prep plan for the day before and the order for the week. If the operations team keeps this list in one place, the forecast can be built against it instead of discovered against it.
5. Add the books: reservations, catering, and gift cards
For the party weeks, your reservation system and catering orders already know a large share of the demand. Use them as the base and forecast only the walk-in remainder. For the dead week and the first week of January, plan for gift-card redemption to lift guest counts while lowering the cash check; the item mix may shift toward entrées and desserts. Data and IT teams can make this easy or impossible depending on whether reservations, catering, gift-card sales and POS item sales can be pulled side by side. If they can’t, this is the month to fix it.
6. Build prep from guests and items, then price it
Here is the mistake the national data warns about, as a hypothetical. A unit averages $3,000 a day in November. The team plans December at $3,450 a day, up 15%, because holidays. If per-day sales run flat in dollars with November, as the Census data show nationally, prep has been built 15% too high for 31 days. At a 30% food cost that is roughly $4,200 of product bought and prepped for guests who didn’t come, per unit, as an upper bound. Multiply across a group. And this year there’s a second trap: menu prices are up about 3.5% from a year ago, so even a dollar forecast that matches last year’s dollars implies fewer guests. I covered that in the menu prices post. Forecast guest counts and items first. Let dollars fall out.
For the big single nights, the Wednesday before Thanksgiving and New Year’s Eve, prep by hour. A night that does three normal days of sales in six hours is an hourly problem, and the hour-by-hour forecasting case study shows what that looks like for a high-volume item. For the party weeks, use the pre-booked covers to set the build on items like butternut squash soup and sparkling wine that spike with groups and die with walk-ins.
7. Set a review cadence and decide the override rules now
Holiday forecasts go stale faster than normal ones because the inputs change daily: a party books, a storm appears, a buyout cancels. Review the forecast twice a week from mid-November through January 3. Agree now on when a manager may override it (a known local event, a weather alert, a booking change) and when they may not (a feeling that it will be busy). Writing that down in October saves a lot of arguments in December. If you want the longer version of the override question, Ordering to Be Safe Is Still a Guess covers the cost of padding a forecast because a day feels risky.
What to copy from last year, and what not to
Copy these
✓ Day-of-week patterns inside each window
✓ Item mix shifts for party weeks and gift-card week
✓ Hourly curves for the two big nights
✓ The shape of the drop from December 31 to January 2
Don’t copy these
✗ Dollar totals, before adjusting for this year’s prices
✗ Any day with a storm, a buyout or a closure last year
✗ Party-week volumes applied to the dead week
✗ A systemwide holiday “lift” applied to every market
What this looks like with a forecasting tool
Everything above can be done by hand with POS exports, a calendar, and a weather site, and plenty of good operators do it that way. What a forecasting tool changes is the update rate. ClearCOGS rebuilds the item-level forecast daily from your POS history, so when the Wednesday before Thanksgiving shifts a day, or a storm appears on the weekend before Christmas, the prep sheet and the order change with it rather than waiting for the next review meeting. The Blue Square Pizza case study is a good example of what daily item-level forecasting does to a high-waste item. The same holiday swings apply to staffing, which is a post of its own.
Want a holiday forecast built from your own stores before Thanksgiving?
Bring last December’s POS data to a short call. We’ll show you how the six windows looked in your own numbers and where the prep was over or under.
Frequently asked questions
Is December the busiest month for restaurants?
Nationally, no. Census Bureau data for U.S. food services and drinking places show December 2025 sales per day about 0.4% below November and 5.1% below August. Individual concepts and markets differ, but the holiday effect shows up in which days are busy more than in the monthly average.
How far in advance should a restaurant forecast the holiday season?
Build the first version in late October or early November, with hours, closures and known bookings filled in. Then review it twice a week through January 3, because reservations, weather and private events change the inputs daily.
How much do restaurant sales drop in January?
In the most recent data, U.S. restaurant sales in January 2026 were 7.4% below December 2025 in total dollars. Plan prep and staffing for the first week of January from early-January history rather than the last week of December.
The one-sentence version
Forecast the holidays as six separate windows built from guest counts, your booking data and last year’s calendar-and-weather-checked days, then review twice a week, because nationally December isn’t a bigger month than November, just a much lumpier one. If you’d like help doing that from your own data, let’s talk.
About the author
Matt Wampler is the CEO and Co-Founder of ClearCOGS. Before founding the company, he ran Jimmy John’s franchise restaurants in the Washington, D.C. suburbs. He hosts the Restaurant AI Podcast.
Disclosure and methodology
Sales figures come from the U.S. Census Bureau’s Advance Monthly Retail Trade report for food services and drinking places, not seasonally adjusted, retrieved from FRED on October 17, 2026. Per-day figures were calculated by dividing each month’s total by its number of calendar days; they are national totals across all restaurant segments and will not match any one concept or market. The most recent months are advance estimates and are revised. The 2025 figures reflect the Census Bureau’s annual revision published in September 2026. The six windows are a planning framework based on operator experience rather than a statistical finding, and the party-week, dead-week and gift-card patterns described will vary by concept. The $3,000-a-day example is hypothetical and an upper bound. The 3.5% menu price figure refers to the Bureau of Labor Statistics’ September 2026 Consumer Price Index, covered in a separate post linked above. ClearCOGS sells forecasting software, so read the tool section with that in mind.
Sources
- U.S. Census Bureau, Advance Retail Sales: Food Services and Drinking Places, not seasonally adjusted, retrieved from FRED, Federal Reserve Bank of St. Louis, series RSFSDPN, data through August 2026, accessed October 17, 2026.
Last reviewed: October 20, 2026


