



By Matt Wampler, CEO of ClearCOGS
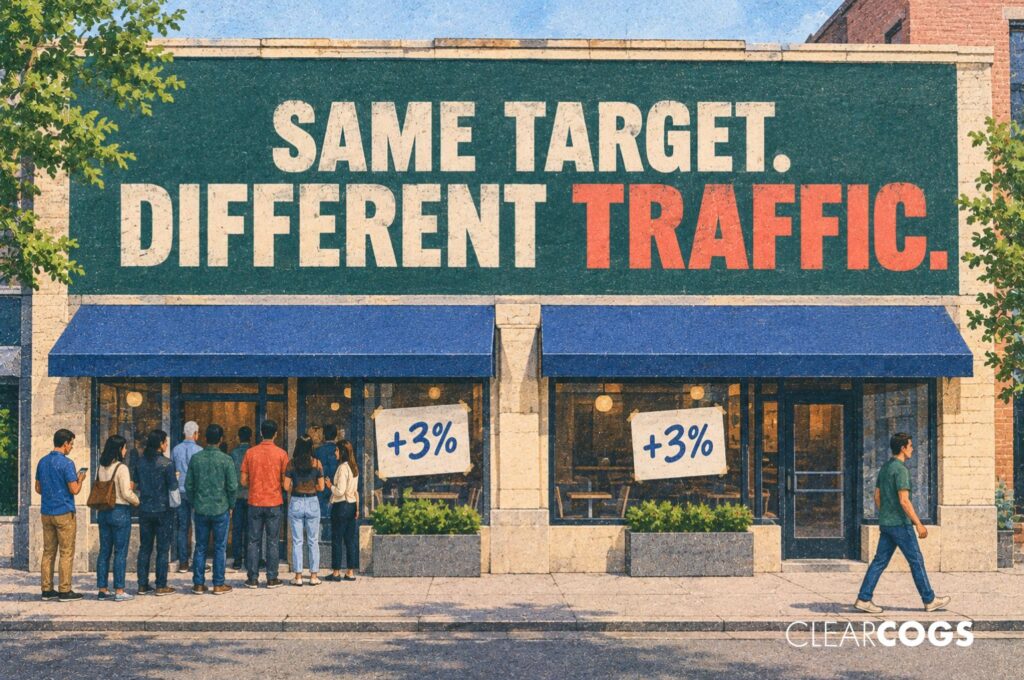
Short answer. Build the 2027 sales budget one store at a time, from three separate numbers: the price you plan to charge, the traffic you expect, and the mix of what guests order. Multiply them per store, then add the stores up. Do not start with one growth rate for the whole group and divide it down, because the industry’s own surveys show sales and traffic are moving in different directions: in September 2026, 54 percent of operators reported higher same-store sales while 44 percent reported lower traffic.
The rest of this post shows the method, a worked two-store example, and the numbers from the National Restaurant Association and the Bureau of Labor Statistics that explain why the split matters this year.
Every November the same two documents get built in a multi-unit group. Finance builds a sales budget from the top: last year plus a growth percentage. Operations builds a labor and prep plan from the bottom: what each store actually sells, by day. When the two disagree, the store manager is the one caught in between. This post is the method I use to make them agree before January.
What is the difference between a sales budget and a sales forecast?
A budget is a commitment. It is one number per store per period, set once, and it drives bonus targets, labor dollars and purchasing limits for the year. A forecast is an estimate that keeps changing. It is updated weekly or daily, and it drives the prep sheet, the order and the schedule.
The budget should be built from the forecast, and then left alone. The forecast should keep running underneath it all year. Trouble starts when a group only has the budget, because then the prep sheet and the schedule get built from a number that was set in November and did not move.
Why shouldn’t you apply one growth rate to every location?
Because a single rate hides the stores that are losing traffic behind the stores that raised prices.
The National Restaurant Association’s Restaurant Performance Index for September 2026 shows the gap at industry level. Fifty-four percent of operators said their same-store sales were higher than a year earlier. At the same time, 42 percent said customer traffic rose, and 44 percent said it fell. The Association notes that September was the 19th time in the last 20 months that operators reported a net decline in traffic. Sales are up for a majority of operators; guests are down for a near majority. The difference is price and mix.
A group-wide “plus 3 percent” budget pretends every store is the 54 percent. The stores in the 44 percent will miss the number in the first quarter, and the miss will look like an execution problem when it was a planning problem.
How do you separate price growth from traffic growth?
Use the three-part identity: sales equals traffic times average check, and average check equals price times mix. In practice that gives you three inputs per store.
- Price. The menu increases you plan to take in 2027, with dates. This is the one input you control. USDA’s October 2026 outlook puts 2027 menu-price inflation at 2.8 percent for the industry, with a range of 0.7 to 5.0 percent; we covered what to do with that range in our memo on the 2027 food cost budget. Your number should be your own plan, checked against that range.
- Traffic. Transactions or guest count per store, from your POS, trailing 13 periods. Use the trend of each store, including the stores where the trend is negative. This is the input that tends to get skipped, because it is uncomfortable.
- Mix. The change in average check that comes from what guests order rather than from price changes. A new cold brew line that sells at a higher check than drip coffee is a mix gain. A shift from entrees to chips and salsa as a shared starter is a mix loss. Mix is usually a small number, but it is the input that explains why two stores with the same price increase end up with different checks.
Here is a labeled hypothetical to show why the split matters.
| Hypothetical two-store group | Store A | Store B | Group |
|---|---|---|---|
| 2026 sales (assumed) | $2,000,000 | $2,000,000 | $4,000,000 |
| Planned price change | +3.0% | +3.0% | |
| Traffic trend | +2.0% | minus 4.0% | |
| Mix change | +1.0% | 0.0% | |
| Bottom-up 2027 budget | $2,122,212 | $1,977,600 | $4,099,812 (+2.5%) |
| Top-down “+3% for everyone” | $2,060,000 | $2,060,000 | $4,120,000 |
| Gap, top-down minus bottom-up | minus $62,212 | +$82,400 | +$20,188 |
All figures are assumed for illustration. Bottom-up budget = 2026 sales x (1 + price) x (1 + traffic) x (1 + mix). Store A: 2,000,000 x 1.03 x 1.02 x 1.01. Store B: 2,000,000 x 1.03 x 0.96 x 1.00.
At group level the two methods are $20,188 apart, which is why finance sees no problem. At store level, Store B has been handed a target $82,400 above what its own traffic trend supports, and Store A has been handed one $62,212 below. If prep and labor at Store B are planned to the top-down number, the store is staffed and stocked for guests who are not coming. As an upper bound, at a 30 percent food cost that is up to $24,720 of product ordered against sales that the store’s own data says will not happen.
How much are guests actually spending at restaurants?
The average U.S. household spent $4,142 on food away from home in 2025, up 5.0 percent from $3,945 in 2024, according to the Bureau of Labor Statistics’ Consumer Expenditures report for 2025, released October 29, 2026. BLS does not flag that change as statistically significant at the 95 percent confidence level. By contrast, the 11.7 percent increase in household spending on meats, poultry, fish and eggs is flagged as significant. Food was 13.0 percent of the average household’s total spending.
The National Restaurant Association’s September survey adds the forward view. Forty-one percent of operators expect their sales volume in six months to be higher than a year earlier, 19 percent expect lower, and 40 percent expect about the same. On the economy as a whole, 20 percent expect conditions to improve, and the Association notes this was the 20th consecutive month of net negative outlook for the economy. Operators are more confident in their own sales than in the economy that produces their guests.
Read together: restaurant spending per household rose in 2025, but not by enough for BLS to call it a clear move, and the people setting 2027 budgets are optimistic about their own stores while being pessimistic about the economy. In my experience that is a setting in which a top-down growth rate tends to be set a little high, and in which the store-by-store traffic trend is the honest check.
How do you turn an annual budget into a weekly forecast stores can use?
The budget is one number per store per period. The forecast has to be one number per store per day, and then per item. The hand-off works like this.
Spread the period budget across days using each store’s own day-of-week shape. A store that does 22 percent of its week on Friday should carry that shape into the budget. Do not use a flat divide-by-seven.
Let the daily forecast move while the budget stays put. Weather, a local event, a new competitor opening: the daily forecast should absorb these within the week. The budget absorbs nothing until the next period review. For the holiday window specifically, we published seven checks for forecasting holiday sales that cover how the daily shape changes in November and December.
Take the item forecast from the daily forecast rather than from the budget. The prep sheet and the order should be built from what the forecast says each item will sell tomorrow. If the budget is used instead, every store ends up prepping to November’s assumptions in July.
This is the part where a group’s tooling matters. The Dinosaur Bar-B-Que team describes using daily forecast-driven prep sheets so that managers can take time off and the smoker still gets loaded correctly in their case study. And Alec Swope, CFO of D&D Management Group, a 35-location Jimmy John’s franchisee in Utah, explains in this video case study why year-over-year comparisons on their own miss what has happened in a store over the last four weeks. Both are the same lesson from two seats: the annual number and the daily number have different jobs.
What should the CFO and the regional director agree on before January?
They should agree on one group total, one bottom-up number per store, and a written rule for how the gap between the two gets closed. This is where the budget usually breaks, so the two positions are worth naming plainly.
The CFO’s position: the group needs a growth number the board will accept, and it needs to be set once. If every store gets its own rate, the total may come in lower than the board expects, and the budget becomes a negotiation with 30 managers.
The regional director’s position: a store with a negative traffic trend cannot be budgeted up by a group average. If it is, the manager either misses the target all year or chases it by cutting labor and over-prepping to look busy, and both show up in the guest experience.
The agreement that works, in my experience, is this. The CFO sets the group total. The regional director builds the store numbers bottom-up and shows the CFO where they add up to less than the total. The gap is then closed by name: specific price moves at specific stores, specific traffic plans at the stores that are down. What does not close by name is left as an unallocated group line, so no single store carries a number its own data does not support.
How often should a multi-unit group re-forecast?
The daily forecast re-runs every day. The period budget is reviewed at the end of each period, and re-based only if a store’s traffic trend has moved by more than the band the group agreed on in November. Re-basing more often than that turns the budget back into a forecast, and the group loses the one fixed number it needed. Re-basing less often leaves a store carrying a dead target for months.
One honest note on fit. If your group is a handful of stores with similar traffic trends, a careful spreadsheet with the three inputs per store will get you most of the benefit described here, and forecasting software like ours is a second-order improvement. The daily layer pays for itself when the number of stores and the number of daily ordering decisions are high enough that small errors compound.
If you want to see how daily forecasting fits under an annual budget for a group your size, Let’s Talk.
What else do operators ask about 2027 sales budgets?
How much will restaurant menu prices rise in 2027?
USDA’s October 2026 Food Price Outlook forecasts menu prices (food away from home) to rise 2.8 percent in 2027, with a forecast interval of 0.7 to 5.0 percent. That is an industry average, so your own planned increases should be the price input in your budget.
Should the sales budget include price increases that have not been decided yet?
Include only the increases that have a date. Undecided increases belong in a scenario, labeled as such. In my experience, budgets that bake in “we will probably raise prices in Q2” tend to drift upward every year.
What traffic number should I use if a store has fewer than 13 periods of history?
Use what the store has, and label the forecast as low-confidence. A store with less history should get a wider band for re-basing, so it is reviewed more often rather than budgeted more aggressively.
Is a 3 percent sales budget conservative for 2027?
It depends on where the 3 percent comes from. If it is 3 percent price with flat traffic, it sits near USDA’s menu-price midpoint and is defensible. If it is 3 percent on top of a store whose traffic is trending down 4 percent, it is aggressive, even though the headline number looks modest.
Disclosure and method
ClearCOGS sells restaurant forecasting software, so we have a commercial interest in operators running daily forecasts under their annual budgets. The Restaurant Performance Index figures were read from the National Restaurant Association’s September 2026 report, released October 30, 2026; the RPI is a survey of operators and its sales and traffic readings are operator-reported, not measured transactions. The household spending figures were read from the BLS Consumer Expenditures 2025 news release of October 29, 2026; BLS notes that survey collection for October and November 2025 could not take place because of the lapse in federal appropriations, and a weight adjustment was used for the missing months. The two-store example is hypothetical and labeled as such. Written November 3, 2026. Published November 2026.
Sources
- National Restaurant Association, Restaurant Performance Index, September 2026 (released October 30, 2026): restaurant.org, RPI September 2026 report (PDF)
- U.S. Bureau of Labor Statistics, Consumer Expenditures 2025, news release USDL-26-1619, October 29, 2026: bls.gov/news.release/archives/cesan_10292026.htm


