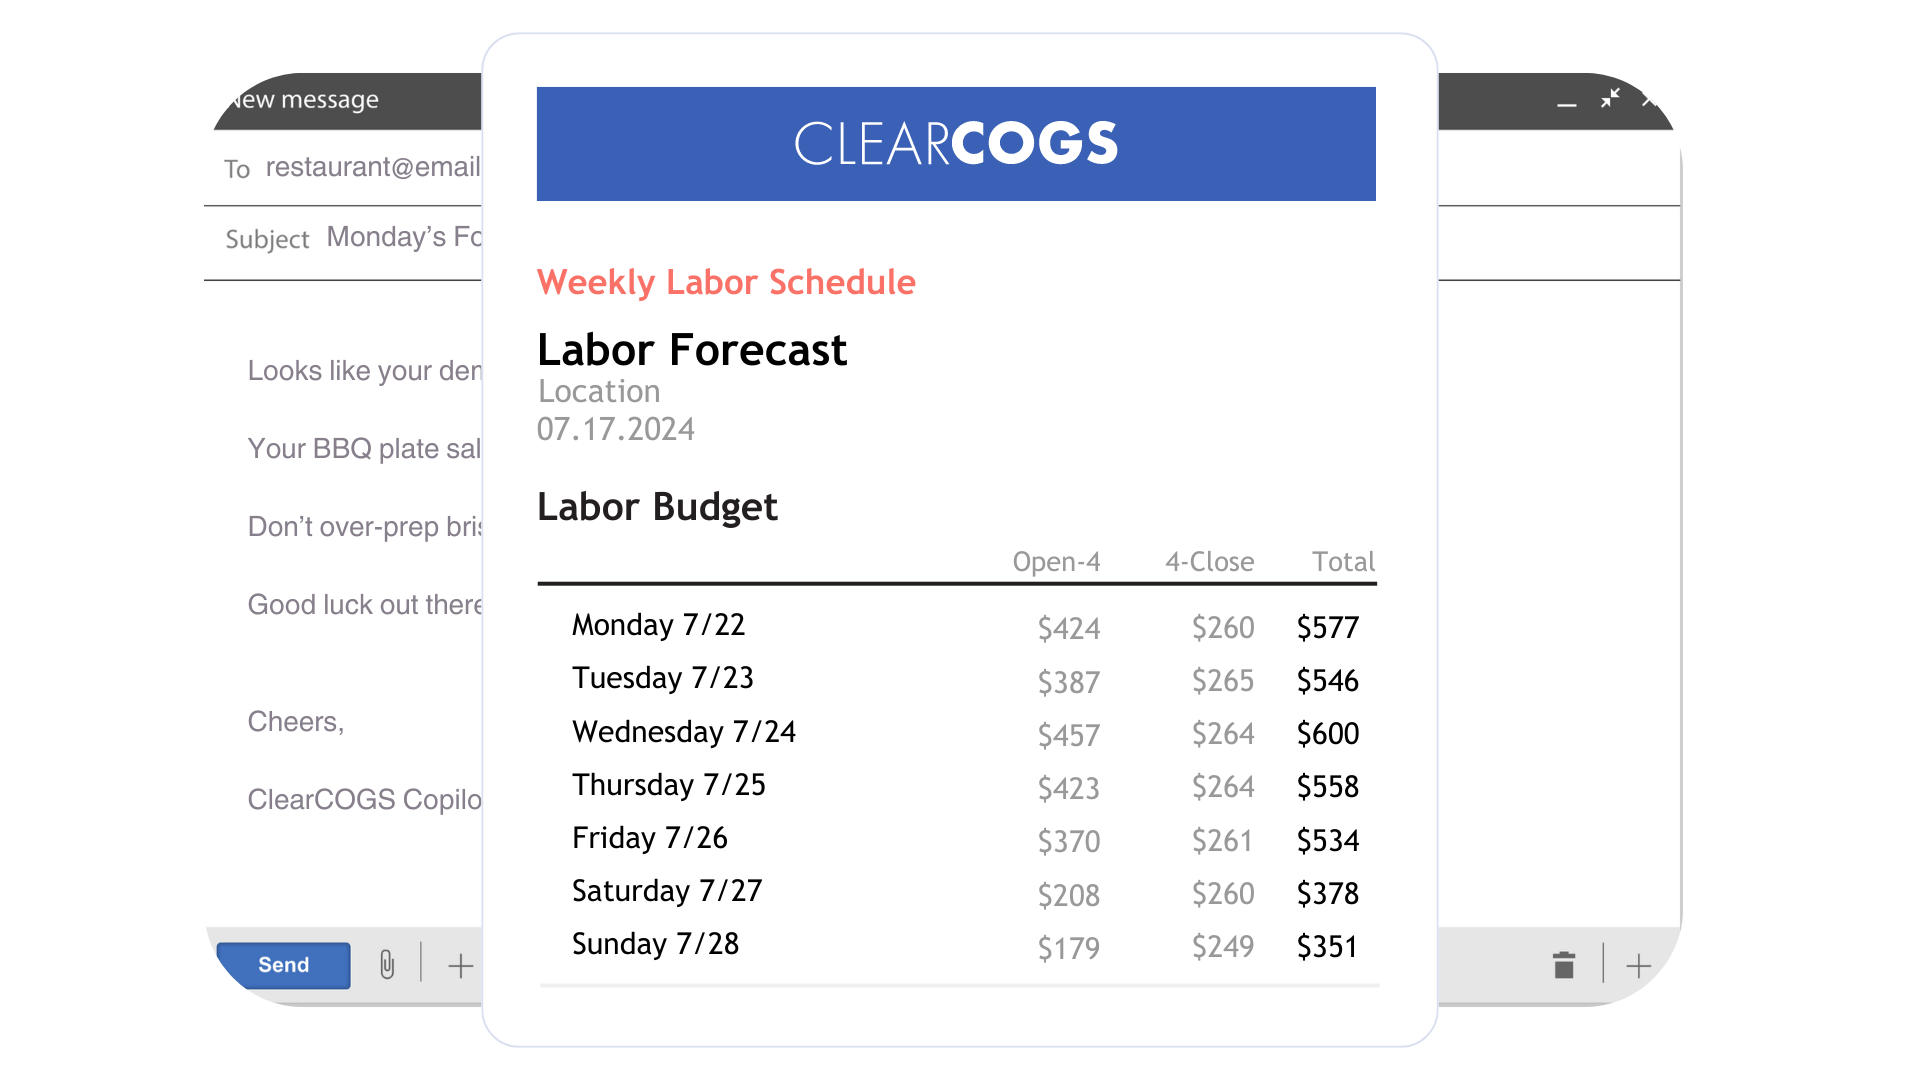



A technology consultant with a hospitality background recently walked us through the operation she is assessing tools for: a five-location, high-volume restaurant group, hundreds of covers on a weekend night, queues out the door. Their rostering process is the industry standard. Managers take a sales budget, layer what she called intuitive smarts on top, and build staff rosters four weeks in advance, revisiting them weekly against actuals. Her verdict on the whole ritual: far too much intuition in this game.
But it was her observation from across several chains she has studied that deserves a framework around it. When these groups “forecast,” what managers actually receive is a single financial number, a daily sales figure. Not covers. Not items. Not an hourly shape. And, as she put it, she does not understand how a manager, not being a computer, is supposed to translate one number into anything meaningful. They do it anyway, because it is all a mere mortal can process.
Here is the argument of this article: that translation is not where schedules go wrong. The managers are mostly good at it. The number they are handed is the weak link, and in strict labor-law markets, the cost of that weak link is amplified by an asymmetry most operators have never priced.
Scheduling Is a One-Way Bet
This group operates in a market with some of the strictest hospitality labor rules in the world: mandated penalty rates after certain hours, minimum shift lengths, and stability obligations to staff. The practical consequence, in the consultant’s words, is that once a roster is posted, they can put a call out to add a shift when things look busy, but they can very seldom cut people.
That asymmetry changes the mathematics of every scheduling error.
| Over-rostered | Under-rostered | |
|---|---|---|
| What happens | Staff are on the floor with too little to do | The floor runs lean during a surge |
| Can you correct day-of? | Rarely; posted shifts and minimums are guaranteed | Partially; call out an extra shift, flex the team |
| Where the cost lands | Paid in full, in wages | Paid partially, in service speed and staff strain |
| Shows up on the P&L as | Wage cost percentage creeping up | Usually invisible |
Assumptions: markets and contracts where posted shifts are guaranteed or costly to cut. In lighter-regulation markets the asymmetry narrows but rarely disappears, because cutting posted shifts spends staff trust even where it is legal.
Notice what this table implies. Every dollar of over-rostering is locked in the moment the roster is posted, up to four weeks before the shift is worked. The manager is not making a staffing decision; they are making a month-ahead forecast with a pen that has no eraser on one side. The wider the error on the sales number, the bigger the tax, and no amount of clever padding fixes it, because padding up burns wages and padding down burns service. The only lever that shrinks both failure modes at once is a more accurate number.
The Weak Link Is the Input, Not the Manager
Now the detail from this group that most operators should sit with. The consultant noted that when the sales number the managers work from happens to be accurate, their wage costs come out very close to target. Read that again: the hard-won skill of translating expected sales into a sensible floor and bar roster, who, how many, in what mix, already exists in these buildings. The managers are good. Their input is bad, because a budget is not a forecast. A budget is a goal set months ago; a forecast is a prediction that accounts for what is actually coming: the season, the weather, the events calendar, the booking pace, last week’s reality.
There is a second flaw in the single number, even when it is right: it has no shape. Two twelve-thousand-dollar days are not the same day. One builds steadily to a long dinner; the other spikes at lunch and dies at nine. Identical daily totals, completely different rosters. A manager scheduling against one number is forced to supply the shape from memory, which is exactly the mental gymnastics the consultant described, performed monthly, per venue, under rules where the downside is locked in.
So the fix is not replacing manager judgment with an algorithm, and it is not another rostering platform; this group already has one they like, and keeping it is the right call. The fix is upgrading the input: an hour-by-hour sales forecast per venue, built from item-level history and the world around each location, handed to the same managers, flowing into the same rostering tool. Keep the translation skill. Replace the guess it operates on.
Stability and Accuracy Are Not Opposites
The standard objection: we roster four weeks out for our people’s stability and for compliance, so what good is a forecast that changes daily? The evidence says stability and performance are complements, not trade-offs. The Stable Scheduling Study, the first randomized controlled experiment on the question, run across 28 retail stores by researchers from UC Hastings, the University of Chicago, and UNC, found that more stable, predictable schedules increased median sales by 7 percent and labor productivity by 5 percent, with treatment stores generating $6.20 more revenue per labor hour. And its quietest finding is the most useful one here: only 30 percent of the variability in weekly payroll hours was explained by week-to-week changes in customer traffic. Most scheduling chaos was not demand; it was noise from upstream.
That maps precisely onto rostering by budget-plus-intuition. When the input number is a guess, every week produces surprises, and surprises produce the churn, the call-outs, the scrambles, that both erode staff stability and drag performance. A four-week roster built on a genuine forecast, refreshed on the weekly revision cadence this group already runs, is more stable, because fewer corrections are needed after posting. Accuracy is what makes the stability affordable.
This is the lane we work in at ClearCOGS: the forecast layer, hour by hour, venue by venue, feeding whatever scheduling system an operation already trusts, so the roster that gets posted four weeks out starts from a prediction instead of a goal. One line of caution earned by experience: a forecast that is badly wrong once loses the room, so the bar for the input is high, and it should be.
The diagnostic takes one spreadsheet and an honest hour. Pull the last eight weeks. For each day, write the sales number your managers rostered against next to what the venue actually did. The average gap, run through your loaded wage rates and your service standards, is the intuition tax you are currently paying, in both directions, on a bet you can only correct one way. Your managers have been absorbing that tax with skill for years. Imagine what they would do with a real number.
Sources
- Williams, J. C., Lambert, S. J., Kesavan, S., et al. Stable Scheduling Increases Productivity and Sales: The Stable Scheduling Study. Center for WorkLife Law, UC Hastings College of the Law. worklifelaw.org