


An analyst briefing on U.S. restaurant customer demand. Research cutoff: June 30, 2026.
Executive summary
Halfway through 2026, the U.S. restaurant industry presents a paradox that the headline numbers obscure. Dollar sales are still growing. Customer visits are not. The National Restaurant Association projects total restaurant and foodservice sales will surpass $1.55 trillion this year, a 4.8% nominal increase over 2025. Yet after adjusting for menu-price inflation, real growth is forecast at just 1.3%. The gap between those two figures is the story of the first half of the year.
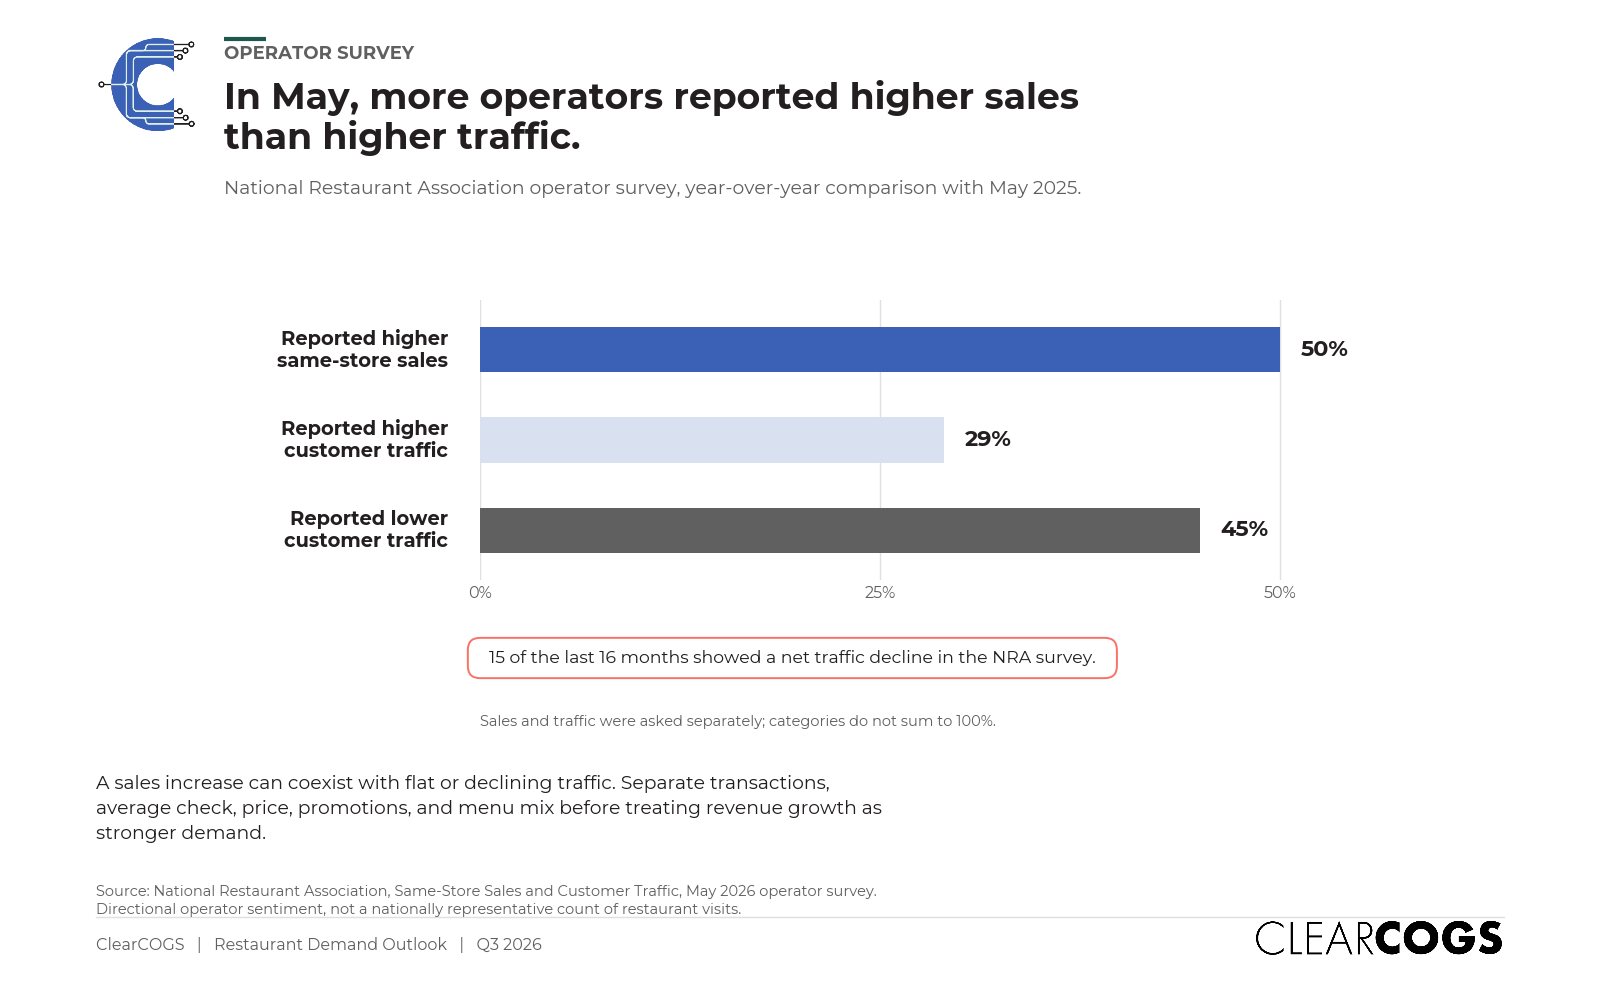
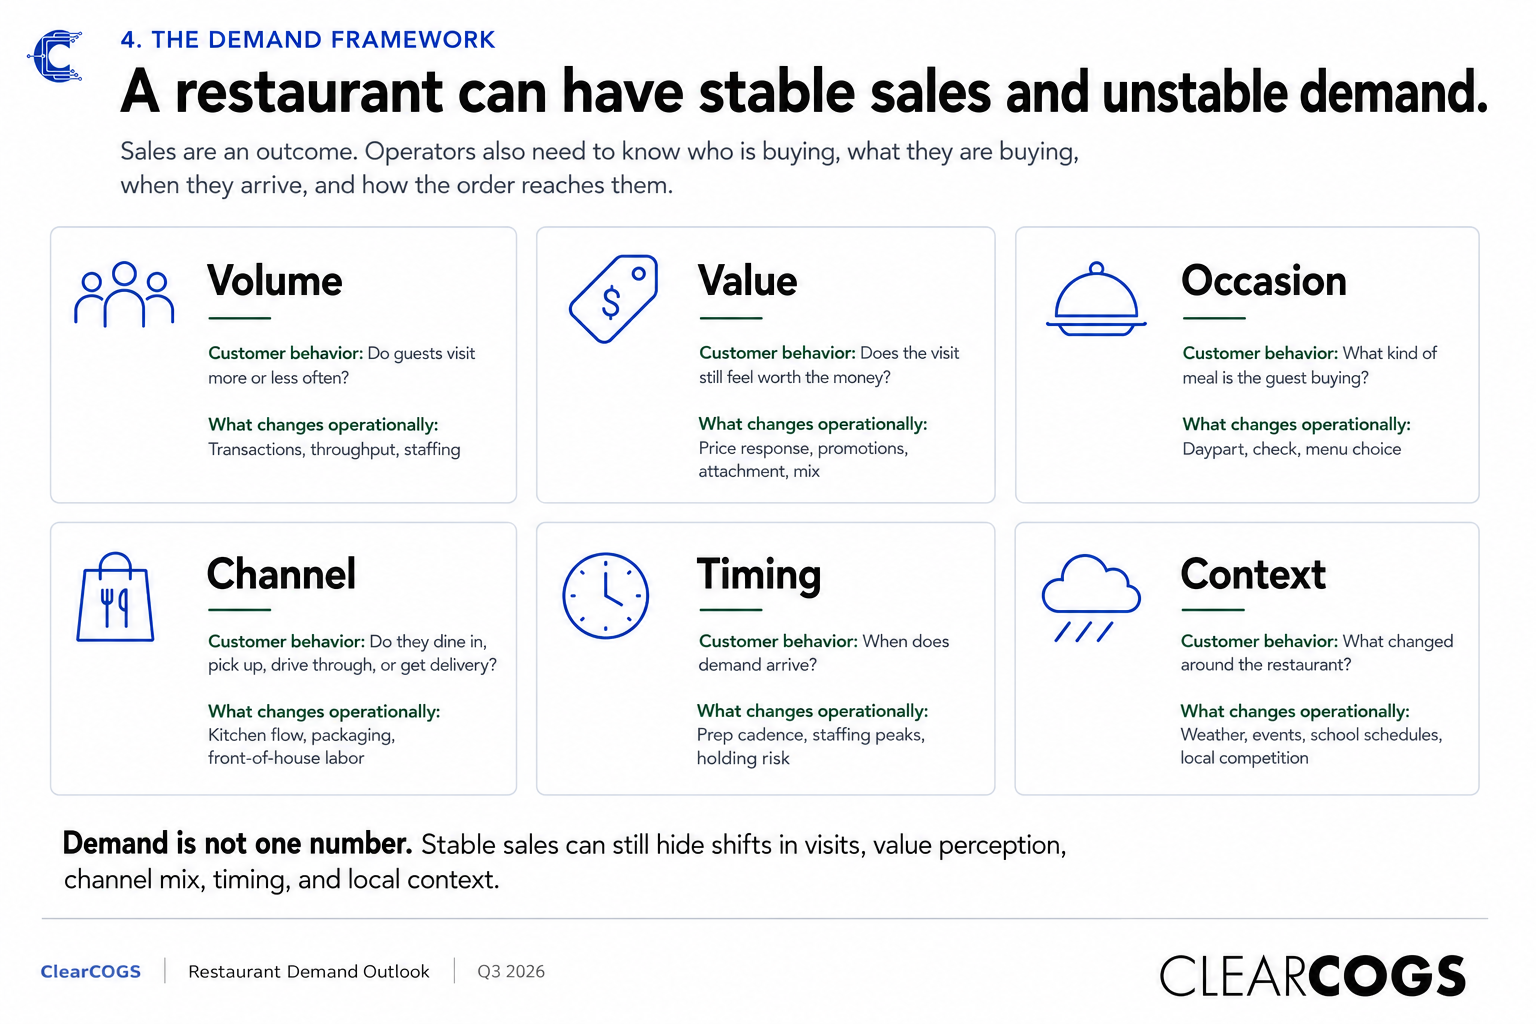
Beneath the topline, demand is not contracting so much as redistributing. The customer is still showing up, but showing up differently: at different price points, in different segments, in different dayparts, through different channels, and with a more deliberate value calculus than at any point since the pandemic. Sales have held up primarily because operators have raised checks, not because more guests are walking in. In May 2026, the NRA reported that 50% of operators saw higher same-store sales year over year while 45% reported lower customer traffic, the 15th time in 16 months that operators reported a net traffic decline.
This report reviews what changed in the first half of 2026, examines the structural forces driving those changes, and lays out three scenarios and a set of watchpoints for the second half. The central analytical conclusion: a single industry sales number is no longer a reliable read on demand. The useful signal lives one level down, in the divergence between segments, cohorts, dayparts, and channels.
Part I. The first half in review: what the data actually showed
Sales grew. Real demand did not.
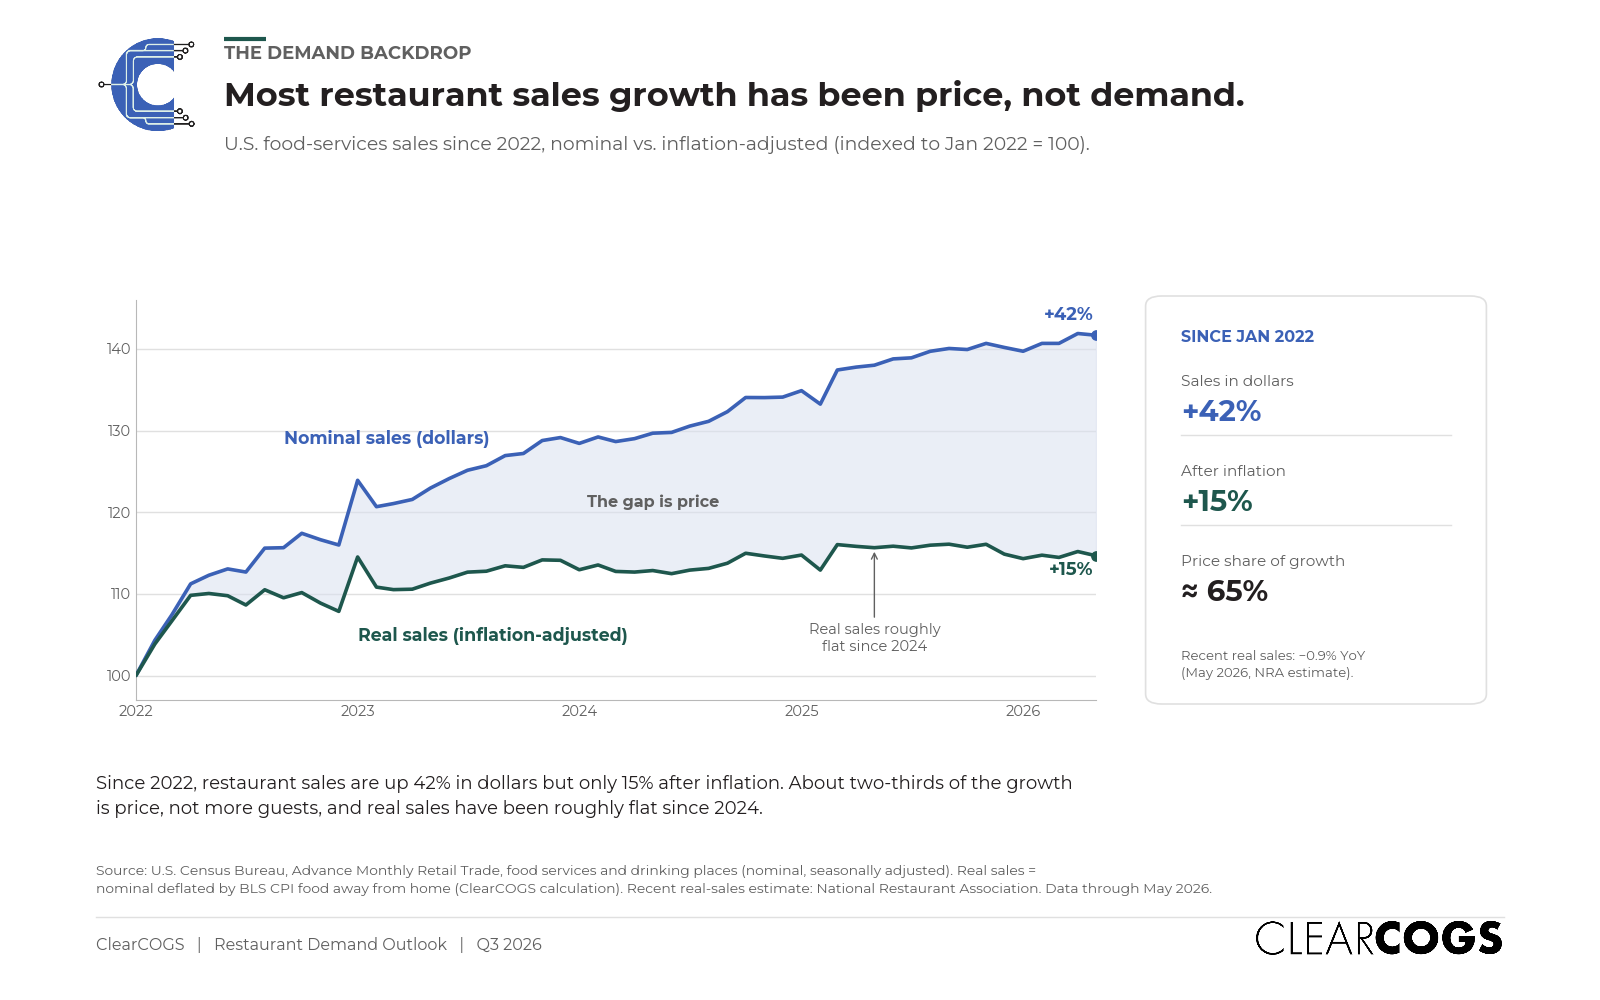
The cleanest way to see the divergence is to put nominal sales next to price growth. The U.S. Census Bureau reported that food services and drinking places were up 2.7% from May 2025 to May 2026 in nominal dollars, but the Census advance retail figures are explicitly not adjusted for price changes. Over the same 12 months, the Bureau of Labor Statistics reported food-away-from-home prices rose 3.5%. Because menu prices climbed faster than sales, the NRA calculated that inflation-adjusted eating-and-drinking-place sales were actually down 0.9% year over year in May, the fourth real decline in five months.
That pattern repeats in the operator survey data. Black Box Intelligence reported January 2026 same-store sales up 1.0% against traffic down 1.1% (following a steep -3.3% traffic reading in December 2025), and February sales up 1.6% against traffic down 2.0%. Revenue Management Solutions’ fourth-quarter 2025 quick-service data captured the mechanism precisely: net sales +1.3%, traffic -2.0%, and average check +3.3%. Guests are spending more per visit and visiting less often.
The responsible interpretation is narrow but important. The 2.7% figure is nominal sales growth, not traffic. The -0.9% figure is an inflation-adjusted sales measure, not a national count of visits. Neither says guests have disappeared. Both say that dollars per visit, not visit volume, is doing the work.
The K-shaped consumer hardened
The most consequential demand story of the first half is the widening split by income. McDonald’s CEO Chris Kempczinski described it directly on the company’s November 2025 earnings call: the U.S. has “a bifurcated consumer base, with QSR traffic from lower-income consumers declining nearly double digits in the third quarter, a trend that’s persisted for nearly two years,” while traffic among higher-income consumers rose nearly double digits.
The operator economics confirm the strain at the bottom. The NRA’s 2026 State of the Restaurant Industry report found that 42% of operators said their restaurants were not profitable in 2025, up sharply from 29% in 2024, a deterioration that occurred in a year when nominal industry sales still grew. Lower- and middle-income households are cutting visit frequency and trading down; higher-income households are largely holding their habits, and in some cases trading up to formats that now offer competitive value per dollar.
Segment performance diverged sharply
Brand-level results in late 2025 and the first quarter of 2026 make clear there is no single “restaurant consumer.” Under identical macro conditions, comparable sales ranged widely:
- McDonald’s posted U.S. comparable sales of +6.8% in Q4 2025 and +3.9% in Q1 2026, helped by aggressive value platforms.
- Taco Bell delivered +8% U.S. same-store sales and +10% system sales growth in Q1 2026, the strongest of the major QSR brands.
- Starbucks reported U.S. comparable sales +7.1% in its fiscal second quarter (calendar Q1 2026), with transactions up 4.3% and ticket up 2.7%, a transaction-led recovery.
- Chipotle managed just +0.5% comparable sales, with transactions up 0.6%, check down 0.1%, and digital at 38.6% of food-and-beverage revenue.
- Dutch Bros posted company-operated same-shop sales +10.6%, transactions +6.9%.
- Pizza Hut, by contrast, was roughly flat at the division level, with U.S. same-store sales -4% offset by international +2%, divergence within a single parent company.
At the bottom end, several brands tied to lower-income or value-exposed bases declined materially. Wendy’s U.S. same-restaurant sales fell 11.3% and Popeyes fell 4.9% in the fourth quarter of 2025.
The defensible conclusion is not that one segment is “winning” nationally. It is that brand-level performance varied substantially even under the same economy, which means the demand proposition each brand offers (price, convenience, speed, experience) matters more than the macro backdrop.
Casual dining’s relative strength, fast casual’s identity problem
The segment-level surprise of the cycle is that casual dining, long assumed to be most exposed to a value-conscious consumer, held up better than fast casual. Black Box Intelligence data shows casual dining led the industry in same-store sales through most of 2025. Chili’s has been the standout, posting same-store sales growth in the high single digits (roughly 8.6% in the most recent reporting) by positioning its price point in direct competition with quick service.
The mechanism is price convergence. As QSR and fast-casual prices rose aggressively, the premium for a sit-down experience narrowed to the point where many consumers concluded it was worth the incremental cost. Fast casual sits awkwardly in the middle: squeezed from below by discounting QSR and from above by casual dining that has closed the price gap. Sweetgreen illustrated the pressure, posting same-store sales -12.8% in Q1 2026 (traffic down roughly 11%). Fine dining, meanwhile, showed resilience (Black Box ranked it at or near the top of all segments for four consecutive months through January 2026) because its higher-income core consumer is largely insulated from the pressures squeezing lower-income traffic.
A note on precision: casual dining’s strength is clearest in sales rather than in confirmed positive full-year traffic, and the exact fiscal-quarter comparisons across casual-dining brands vary because several report on offset fiscal calendars. The directional signal, casual dining outperforming fast casual on value convergence, is well supported.
The daypart map was redrawn
Late night is the growth story. Santiago & Company’s 2026 analysis shows late-night sales at limited-service restaurants growing more than 10% per year since 2021, with the daypart up roughly 46% on a cumulative indexed basis since 2021, the strongest of any daypart. By the same index, dinner is up about 11% and lunch about 7% cumulatively, while breakfast is down.
Breakfast is the most challenged daypart. Kempczinski called breakfast “absolutely the weakest daypart,” noting it is the easiest occasion for a stressed consumer to skip or move home. QSR breakfast traffic fell roughly 8.7% in the second quarter of 2025 before a partial recovery. Notably, this is a quick-service phenomenon: full-service breakfast showed resilience, with Toast platform data showing 9 a.m. reservations up 19% year over year in Q3 2025, the largest booking increase by hour on the platform, likely aided by return-to-office patterns.
Off-premises is the baseline, and channel economics are shifting
Off-premises dining (takeout, drive-thru, and delivery) now accounts for nearly 75% of all restaurant traffic, per NRA research, and that share has not reverted post-pandemic. Roughly two-thirds of Gen Z consumers say takeout is essential to their lifestyle.
Within off-premises, the economics increasingly favor pickup over delivery. A 2025 LendingTree study found third-party delivery runs nearly 80% more expensive than pickup for an equivalent order once fees, surcharges, and tips are included. For higher-income consumers, delivery remains convenient enough to justify the premium; for value-seeking consumers, it has become a targeted occasion rather than a routine.
Catering has emerged as the fastest-growing off-premises channel. Olo reports roughly 100% year-over-year catering growth between 2024 and 2025, with an average catering ticket near $350, roughly ten times a typical mealtime ticket. Hybrid work is a meaningful driver, as mid-week office clustering creates predictable Tuesday-through-Thursday catering demand. The broader catering market is projected to grow about 6.2% annually to more than $140 billion over the next decade.
Part II. Why demand changed: the structural forces
1. The restaurant-versus-grocery price gap
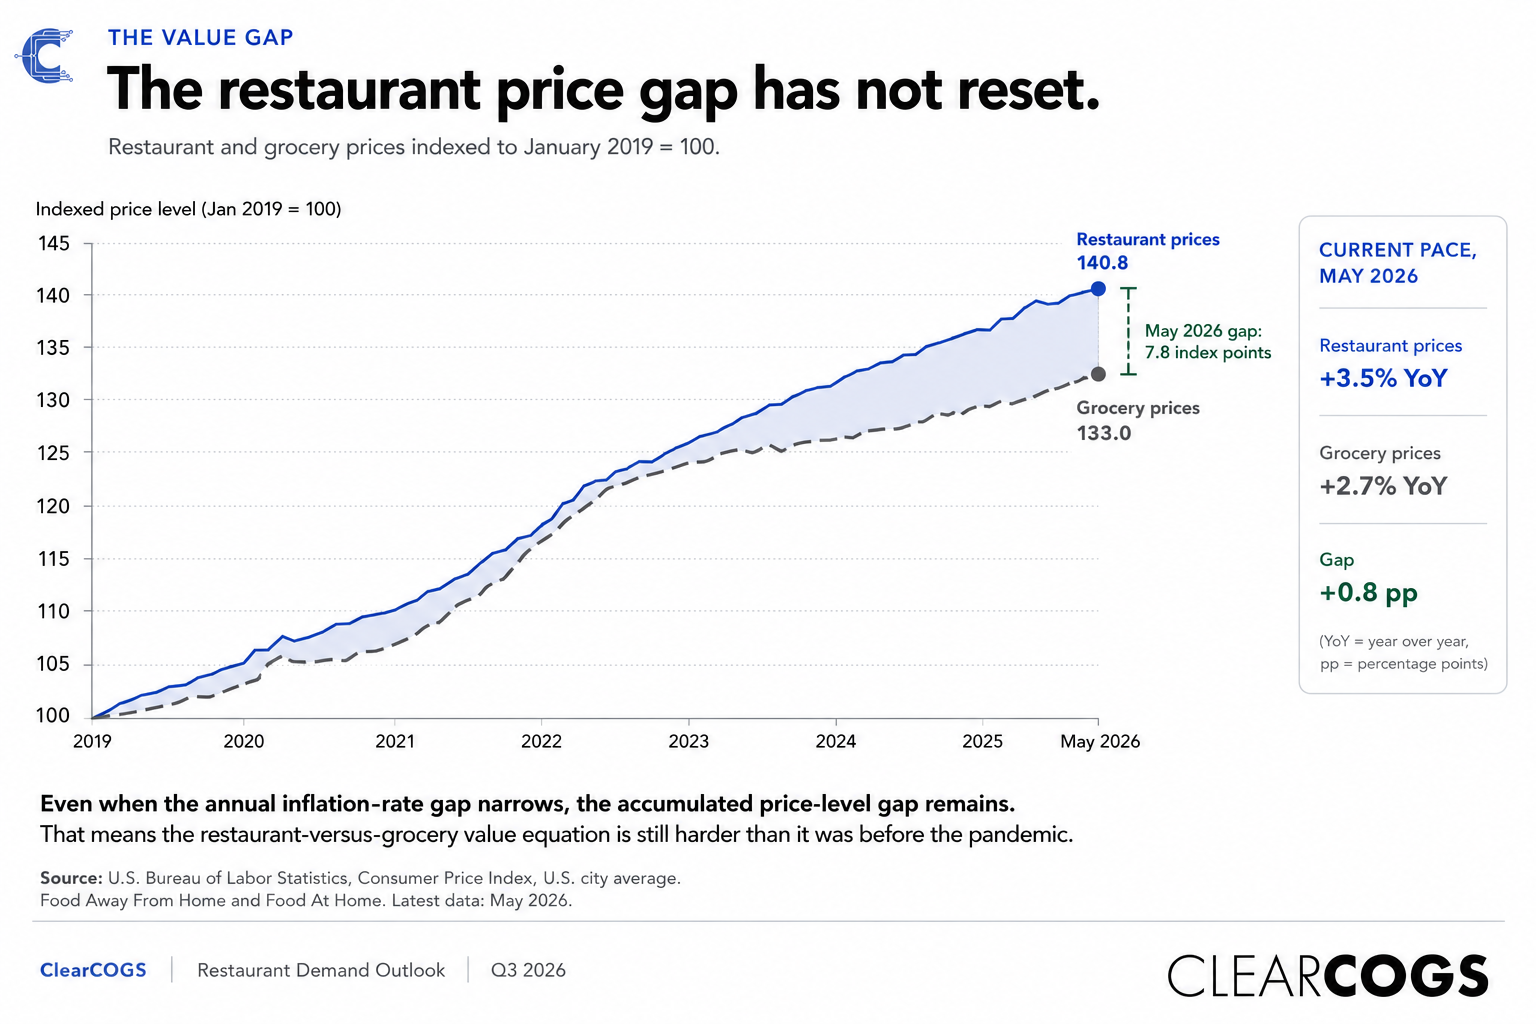
The most quantifiable cause of traffic softness is the cumulative inflation gap between eating out and eating at home. In 2024, food-away-from-home prices rose 4.1% versus just 1.2% for groceries. The gap has narrowed but persists: for the 12 months ending May 2026, food-away-from-home was up 3.5% versus 2.7% for food at home, with full-service meals up 3.8%. The USDA’s Economic Research Service forecasts food-away-from-home prices rising 3.6% in 2026 against 2.8% for groceries.
The cumulative effect since the pandemic is larger and more visible to consumers. Mizuho’s analyst Nick Setyan estimates that burger-focused QSR prices have risen roughly 50-55% since 2019, versus about 30% for groceries, and argues that roughly 10% of prior restaurant traffic has migrated back to grocery over the past two years. When a quick-service meal was priced at a few dollars per person, the convenience trade-off was easy; at current price points, it is a genuine decision.
A new competitive threat has emerged in the value tier: convenience stores. A 2026 Tillster survey found 78% of consumers say c-store prices are equal to or better than fast food and fast casual, and the share rating c-stores as offering the most overall value rose from just 4% in 2025 to 16% in 2026.
2. GLP-1 medications
The rise of GLP-1 weight-loss medications represents the first pharmacological influence on food demand in the industry’s history, though its effect is more nuanced than early commentary suggested. KFF’s Health Tracking Poll found that as of late 2025, 12% of U.S. adults, about one in eight, were taking a GLP-1 medication, double the 6% reported in May 2024. Circana reports that roughly 23% of U.S. households now include at least one GLP-1 user. J.P. Morgan projects more than 30 million Americans on GLP-1 therapy by 2030, up from roughly 10 million in 2026.
The demand implications cut in two directions. In the near term, the drugs suppress appetite and shift what users buy. A Cornell University study of 150,000 households found limited-service (fast food and coffee) spending down about 8% within six months of starting a GLP-1, with savory snacks down about 10%. Technomic found roughly one-third of GLP-1 users report visiting restaurants less often. But Circana’s longer-horizon data is more reassuring for restaurants than for grocery: after a full year on the medication, total restaurant spending by users was up slightly (+0.9%), with casual-dining spending up 4.1% and QSR up 0.6%, even as packaged-food and beverage spending fell 1.6%. Users are reducing items per trip by about 1% and shifting toward protein-forward, high-fiber, smaller-portion options, with double-digit increases in categories such as croissants, soft pretzels, fruit smoothies, and hot tea.
The magnitude of the longer-term grocery and foodservice impact is debated. KPMG’s analysis estimates GLP-1 adoption could reduce food-and-beverage spending by roughly $48 billion per year in its base case over the next decade, with higher-case estimates reaching about $55 billion. The arrival of lower-cost oral formulations is expected to accelerate adoption.
3. Generational divergence
Spending is dividing by generation in ways that defy conventional wisdom. Technomic reports that Gen Z has surpassed millennials as the most frequent restaurant-visiting generation. But Gen Z’s relationship to quick service is weakening: McKinsey found Gen Z’s spending growth at limited-service restaurants slowed by 19 percentage points over roughly two years, a steeper deceleration than older cohorts. And a YouGov survey found 61% of Gen Z agree that dining out is a treat reserved for special occasions: the visit is the occasion, not a routine meal. The strategic implication is that brands designed to capture Gen Z as a daily QSR habit are misreading the generation, which increasingly treats dining out as an experience to invest in rather than a transaction to repeat.
4. Work patterns and the geography of demand
Hybrid and remote work continue to reshape where and when people eat, even as return-to-office trends evolve. The clearest effect is on the morning daypart: when commuting is the trigger for a coffee-and-breakfast stop, remote workers who stay home simply lack the occasion, which is part of why QSR breakfast has struggled even as full-service breakfast has recovered on return-to-office days. Catering is the positive flip side: mid-week office clustering generates predictable recurring demand that restaurants are increasingly capturing.
5. Value is now broader than price
Qualitative research consistently shows that the decision to eat out has shifted from automatic habit to considered occasion. McKinsey’s 2026 consumer work identified value and pricing as the top-of-mind consideration, but found that among consumers who felt dining out “wasn’t worth the money,” the leading grievances were food quality and portion size, not price alone. The NRA’s research similarly frames value as a composite of price, quality, convenience, speed, loyalty, and digital ease. The NRA’s Q2 2026 Quarterly Consumer Insights found 56% of consumers had dined at a restaurant in the past week, confirming restaurants remain a top discretionary category, even as 36% reported spending less than the prior quarter.
Part III. The second half: three scenarios
How demand evolves through the back half of 2026 depends largely on how the restaurant-versus-grocery price gap, consumer confidence, and GLP-1 adoption resolve.
Scenario 1: Gradual recovery (base case). Restaurant price increases continue to slow toward grocery inflation, easing the perceived-value pressure that has driven trade-down. Consumer confidence stabilizes; the Conference Board’s index ticked up to 91.2 in June 2026. Traffic returns to roughly flat or slightly positive across most segments, with casual dining continuing to outperform and QSR recovering selectively on value platforms. This aligns with the consensus forecast: the NRA projects real industry growth of 1.3% for 2026, and Technomic projects real-growth improvement in the range of 1.2-2.1%.
Scenario 2: Value war intensifies. QSR operators sustain aggressive discounting to rebuild traffic, compressing margins and accelerating the blurring of segment lines. Casual dining holds its relative value position but faces margin pressure if input costs rise. Fast casual is most exposed, squeezed from both sides. Industry traffic stays flat to slightly negative, with sharp brand-level divergence between those who “own value” and those who lose share.
Scenario 3: Demand contraction. A combination of renewed inflation, a softening labor market, and accelerating GLP-1 adoption drives a second leg of traffic decline. Lower-income households cut visits further, and the K-shape widens. Industry traffic declines on the order of 1-2% again, masked by check inflation. Given that 42% of operators were already unprofitable in 2025, this scenario is most dangerous for independents and smaller chains with the least pricing power.
The base case is the most probable, but the distribution of outcomes is wide, and it is unlikely to be uniform across segments. The more useful expectation is continued divergence: casual dining and higher-income-skewed concepts outperforming, value-exposed QSR and mid-tier fast casual underperforming, regardless of which aggregate scenario prevails.
Part IV. What to watch in the second half
The following indicators are the highest-signal monthly reads on which scenario is unfolding.
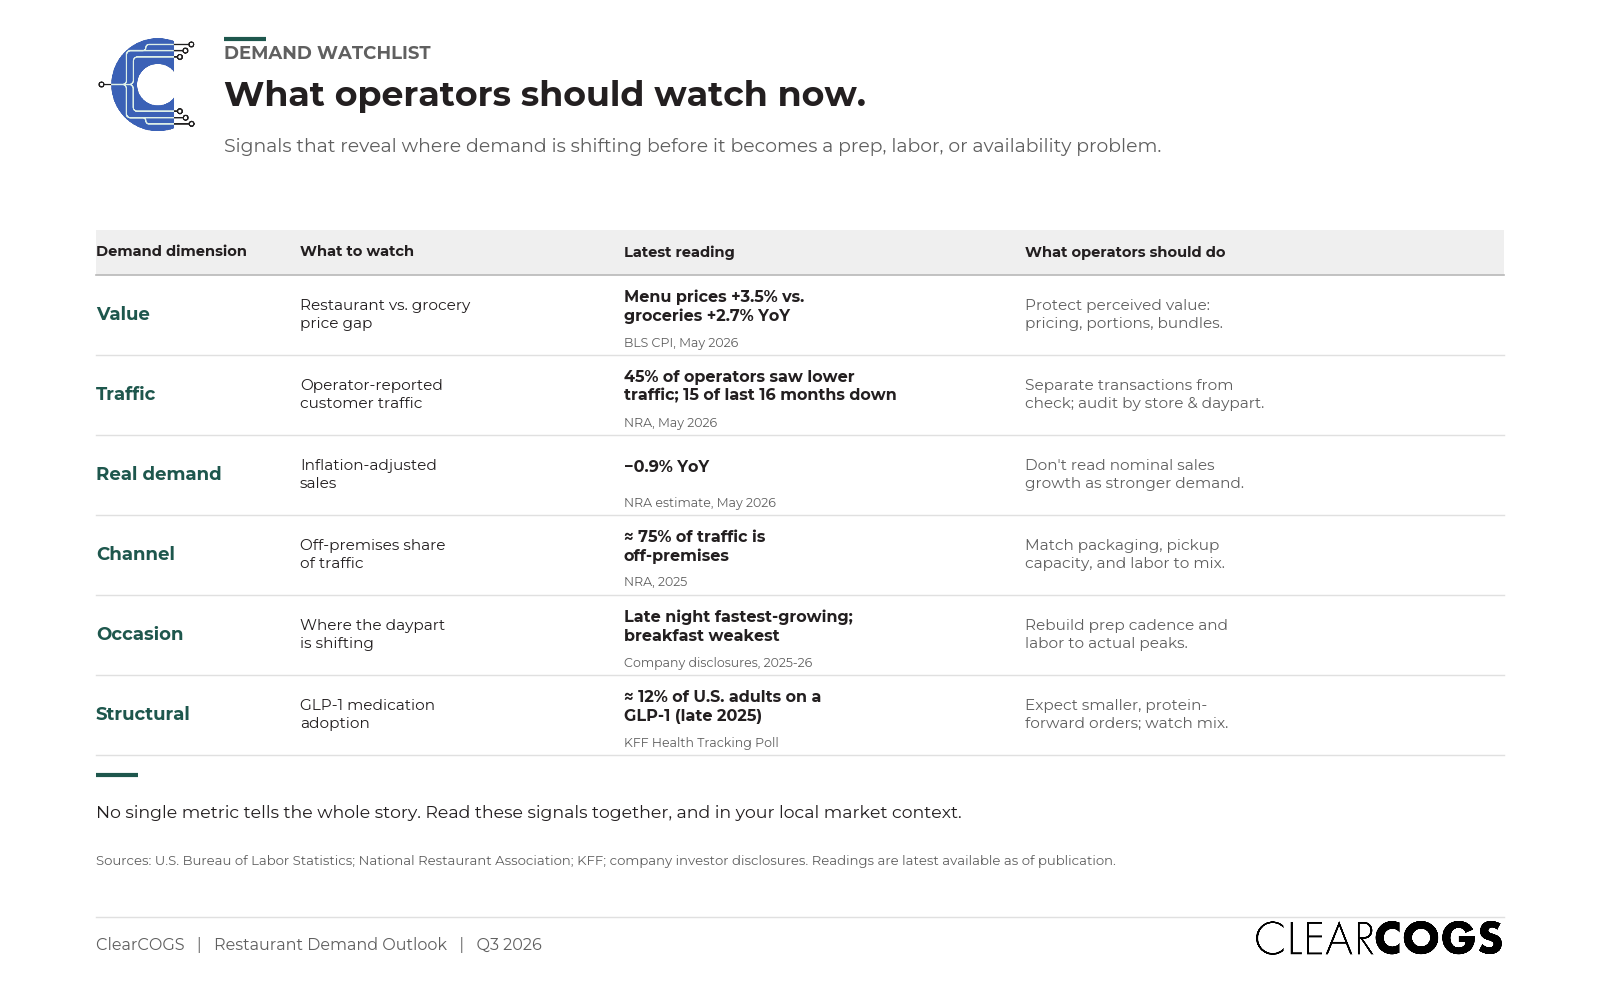
The deeper point: volatility moved inside the average
The most underappreciated implication of the first half is that volatility has migrated inside the aggregate. Even with relatively stable industry sales, the distribution of demand around the average has widened: late night up while breakfast is down, pickup gaining while delivery concentrates, weekends and weekdays diverging, casual dining outperforming while value QSR struggles. A business that plans against a single industry number is optimizing for an average that increasingly fails to describe any actual day, segment, or location.
For operators, that raises the cost of being wrong. In a year when 42% of operators were unprofitable despite nominal sales growth, the margin for error on pricing, mix, and capacity is thin. The analytical takeaway for the second half is the same as the lesson of the first: watch the divergence, not the average. The restaurant customer has not left. The pattern of demand has changed, and it changes faster than the monthly headline can capture.
Methodology and limitations
This briefing relies exclusively on publicly available sources: U.S. government statistical releases (Census, BLS, BEA, USDA), National Restaurant Association surveys and research, company investor-relations disclosures and SEC filings, and reputable industry research and trade press. Government figures are nominal unless labeled real (inflation-adjusted). Operator survey data (NRA monthly tracking, Black Box Intelligence) reflects industry sentiment and directional change, not a probability-weighted census of all restaurant traffic. Company comparable-sales figures are illustrative of brand-level divergence and are not a representative sample of the industry; several brands report on offset fiscal calendars, which can shift a “Q1 2026” label by a few weeks. Where a specific figure could not be independently verified against a primary source (for example, certain daypart-recovery data points and survey sub-figures), it has been softened, attributed conservatively, or omitted. Forward-looking scenarios are analytical judgments, not forecasts.
Sources
- National Restaurant Association. 2026 State of the Restaurant Industry (press release). restaurant.org
- National Restaurant Association. Same-store sales and customer traffic (monthly tracking). restaurant.org
- National Restaurant Association. Total restaurant industry sales (real-sales calculation). restaurant.org
- National Restaurant Association. Quarterly Consumer Insights, Q2 2026. restaurantnewsresource.com
- National Restaurant Association. From Trend to Transformation: Off-Premises Dining (2025). restaurant.org
- U.S. Census Bureau. Advance Monthly Retail Trade Report (June 17, 2026). census.gov
- U.S. Bureau of Labor Statistics. Consumer Price Index, May 2026. bls.gov
- U.S. Bureau of Economic Analysis. Personal Income and Outlays, May 2026. bea.gov
- USDA Economic Research Service. Food Price Outlook. ers.usda.gov
- Black Box Intelligence. Restaurant Industry in Review, January 2026. blackboxintelligence.com
- Black Box Intelligence. Restaurant Industry in Review, February 2026. blackboxintelligence.com
- Revenue Management Solutions. Restaurant Trends: January 2026 (Q4 2025). revenuemanage.com
- Mizuho. A more rational consumer is rewriting the restaurant playbook. mizuhogroup.com
- Santiago & Company. The Top Restaurant Industry Trends for 2026. santiagocompany.com
- McDonald’s. Q4 2025 results and Q1 2026 earnings coverage. corporate.mcdonalds.com; cnbc.com
- Yum! Brands. Q1 2026 results (Taco Bell, Pizza Hut). sec.gov
- Chipotle. Q1 2026 results. newsroom.chipotle.com
- Starbucks. Q2 FY2026 results. investor.starbucks.com
- Dutch Bros. Q1 2026 results. sec.gov
- Brinker International / Chili’s comparable-sales coverage. fool.com
- Wendy’s Q4 2025 results coverage. verdictfoodservice.com
- Sweetgreen. Q1 2026 results. sec.gov
- Toast breakfast/reservation data (Q3 2025). restaurantdive.com
- LendingTree. Delivery vs. pickup cost study (2025). lendingtree.com
- Olo. The Catering Boom. olo.com
- Tillster Phygital Index via C-Store Dive (April 2026). cstoredive.com
- KFF. Health Tracking Poll on GLP-1 use (late 2025). kff.org
- Circana. GLP-1 users and restaurant spending (Nov 2025). circana.com
- Circana. GLP-1 medication users and food-and-beverage sales. circana.com
- J.P. Morgan Global Research. Obesity drugs outlook (Feb 2026). jpmorgan.com
- Cornell University. How GLP-1s change what Americans buy (Dec 2025). news.cornell.edu
- KPMG. GLP-1 medications’ impact on the food and beverage industry. kpmg.com
- McKinsey. What US consumers want from restaurants in 2026. mckinsey.com
- Technomic. Gen Z surpasses millennials as most frequent restaurant users (via NRN). nrn.com
- YouGov. How Gen Z eats out (Aug 2025). yougov.com
- The Conference Board. Consumer Confidence, June 2026. prnewswire.com


