




By Matt Wampler, CEO of ClearCOGS
An operations leader at a sports-focused bar and restaurant group, nearly twenty corporately owned locations, said something on a recent call that most forecasting vendors never want to hear: our year-over-year comps are basically pointless.
He wasn’t being dramatic. When the home team plays, one of his locations can do a fifty-thousand-dollar day. When the team is out of town, the same location might do a twentieth of that. That is not variance around a trend. That is two different businesses taking turns inside one building, and no average of the two describes either one.
The Comp Assumes the Calendar Repeats
Every standard forecasting tool in restaurants rests on one quiet assumption: that the calendar rhymes. This Saturday should look something like last Saturday, or like the same Saturday last year. For most restaurants, that assumption mostly holds, which is why comps and moving averages survive.
For an event-driven restaurant, the assumption is false at the foundation. Sports schedules do not repeat. Home stands land on different weekends than last year. Opponents change, and a rivalry game and a Tuesday matchup against a last-place club are different animals wearing the same date. Seasons end. Playoffs appear out of nowhere, which is the entire point of playoffs. So the comp is not comparing this Saturday to a similar Saturday; it is comparing a game day to whatever happened to occupy that square of the calendar a year ago. And a trailing average does something worse: it blends the fifty-thousand-dollar days and the two-thousand-dollar days into a smooth number that has literally never occurred.
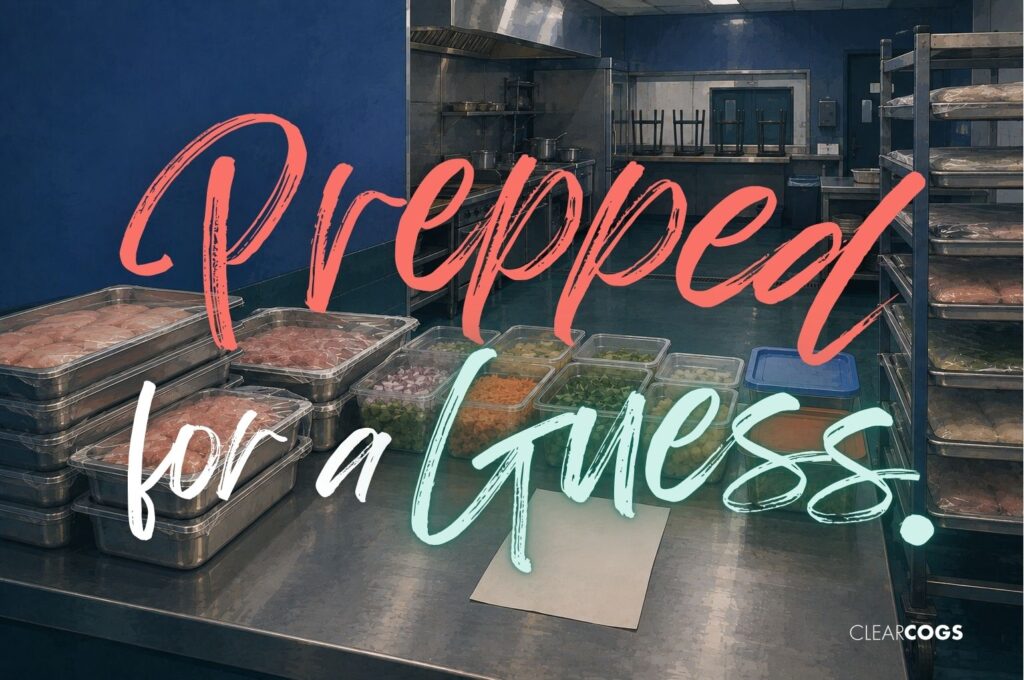
The operational stakes are higher here than at most restaurants, too. This group runs on pre-batched product, with the night crew pulling tomorrow’s food the evening before. The biggest food decision of the day is made more than twelve hours out, precisely when a wrong guess has the longest time to become expensive: thaw too much for a road-trip weekend and it is waste, too little for a home stand and the busiest day of the month runs short.
The Demand Is Not Random. It Is Just Not Yours.
Here is the reframe that changes the problem. This operator’s demand is not unpredictable. It is arguably among the most predictable demand in the industry, because its primary driver is published months in advance, in public, by the league. What makes it feel chaotic is that the signal lives outside his own sales history, and traditional tools only ever look inward.
The size of that outside signal is not subtle. Bank of America Institute research on sports and local economies found that overall card spending in the zip code of St. Louis’s baseball stadium ran 68.3 percent higher during the MLB season, and cites an academic study of the 2019 season that measured game-day surges of up to 38 percent in local business revenue, with restaurants and bars leading the categories. Just as telling, the researchers found the effect is intensely localized: the boost concentrates in the host zip codes and fades fast outside them. If your building sits inside that zone, the game is not an influence on your sales. It practically is your sales.
Which means the honest description of this operator’s problem is not “our demand is volatile.” It is “our forecast refuses to look out the window.”
Forecast From Drivers, Not From History Alone
The fix is a different kind of forecast, one built to ingest external signals rather than merely extrapolate internal history. The home game schedule. Day game versus night game. Opponent. What else is happening in the district that day: the arena next door, the convention center, the concert calendar, the weather that moves a patio. A model trained on the location’s own transaction history against those drivers stops asking “what did we sell last Saturday?” and starts asking “what do we sell when these conditions occur?” It learns your building’s personal response curve to each driver, because a stadium-district bar and a place two miles away respond to the exact same game completely differently, exactly as the localization data shows.
It helps to be precise about a distinction we have written about before, because it sorts every “event” an operator faces. Events you book, like catering and private parties, are known revenue: subtract them from the forecast and plan them directly. Events someone else schedules, games, conventions, concerts, graduation weekend, are external drivers: you cannot subtract what you never booked, so the forecast has to ingest them. Confusing the two is how event-adjacent restaurants end up with tools that treat their biggest sales driver as statistical noise.
And nearly every restaurant has a quieter version of this operator’s problem. A campus nearby means your calendar is the academic calendar. A courthouse means jury duty Mondays. A beach means you are in the weather business. The question that sorts it takes one minute: list the five outside things that swing your sales the hardest, then ask whether your current forecast knows any of them exist. If your best manager already checks the game schedule before writing the pull list, congratulations: your operation already believes in driver-based forecasting. It is just running the model on one tired human.
This is the exact class of problem we built ClearCOGS for: forecasts that read your POS history and the world around each location, so the night crew’s pull list on a Friday reflects who is actually coming Saturday. The fifty-thousand-dollar day and the two-thousand-dollar day are both predictable. They just cannot be predicted by a tool that thinks the answer is somewhere in their average.
Sources
- Bank of America Institute. On the Ball: Local Economies Score When Sports Kick Off. August 2025. institute.bankofamerica.com


