


There’s a specific type of restaurant operator who has been through the forecasting tool cycle. They’ve bought a system, watched it generate a number, compared it to what actually sold, and walked away quietly furious.
The system said 20. Reality was 40. The system said 7. Reality was 30. After enough of those moments, the conclusion arrives fast: if this thing is guessing, I can guess on my own.
These operators are right to be skeptical. And paradoxically, they’re often the best candidates for forecasting that actually works.
The Problem With the Standard Approach
Most forecasting tools built for restaurants rely on relatively simple methodologies basic time series, four-week rolling averages, or lightweight machine learning that leans heavily on recent sales without accounting for much else. These tools produce a number. They don’t produce a reliable number.
The result is a familiar failure mode: the system looks fine on the surface, passes a few demos, gets implemented, and then quietly loses the trust of every manager who uses it. Not because the managers are wrong to question it. Because the tool wasn’t actually accurate enough to defend itself.
Operators who’ve experienced this know the specific frustration of watching a forecasting number and knowing, instinctively, that it’s going to be wrong today. The experienced ones stop using it. The newer ones follow their example. Within months, the tool is technically running in the background and functionally invisible.
What Good Validation Actually Looks Like
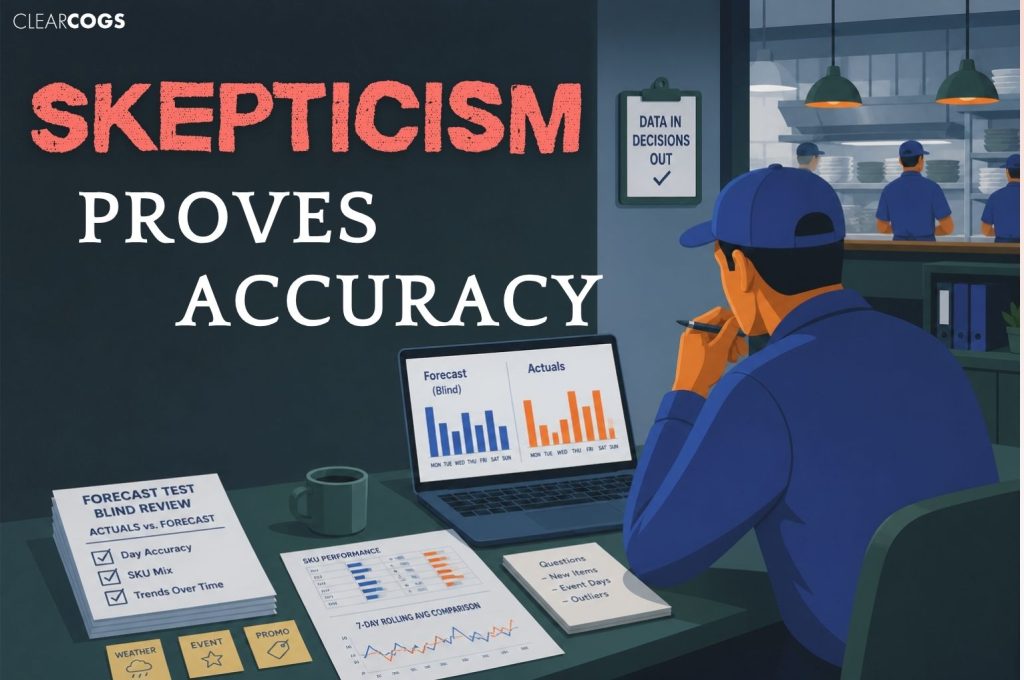
The most rigorous operators don’t take forecasting vendors at their word. They run their own tests.
The methodology is straightforward: share historical data up to a point in time the operator already has actuals for. Ask the system to forecast what it would have predicted for a period it has never seen. Then compare.
This blind test approach is the right way to evaluate forecasting tools, and more operators should be doing it. A forecast that looks plausible in a demo is not the same as a forecast that holds up against real data in real conditions.
The specific things to watch for in a blind test:
Day-level accuracy is not the right benchmark alone. Any single day can be off for unpredictable reasons an unexpectedly slow Tuesday, a catering pickup that wasn’t in the data, a weather event. The question is whether the system is directionally right over a sustained window. A seven-day rolling average comparison tells you far more than any single day.
SKU-level matters more than total volume. A system that correctly predicts total sales but scrambles the product mix doesn’t help with prep decisions. For any operation running multiple SKUs with different prep requirements, the mix prediction is where the real value lives and where most tools fall apart.
New products require different handling. Any item that didn’t exist in the training data needs special treatment. A forecasting system should acknowledge this rather than generate a number based on nothing. Operators know which items are new; the system needs to as well.
Promotions and events require flagging. Limited-time items, seasonal configurations, and promotional combos create noise that corrupts historical patterns. The system should either handle these variables explicitly or exclude them with transparency not silently incorporate them as if they were typical demand.
The Four-Week Average Trap
The vast majority of restaurant forecasting tools are, at their core, four-week moving averages with varying levels of sophistication layered on top. The marketing material describes machine learning. The actual output is a smoothed historical average.
This matters because a four-week average is structurally blind to anything that falls outside recent patterns. It cannot meaningfully account for year-over-year seasonality, multi-year demand trends, or the kind of long-range pattern recognition that distinguishes genuine machine learning from statistics dressed up in better language.
Operators who’ve done the comparison between a decent spreadsheet and the tool they paid for often find the gap smaller than expected. That’s not because their spreadsheet is good. It’s because the tool wasn’t much better.
The vendors who lean most heavily on “AI” in their positioning often have the thinnest actual methodology underneath. The ones who are willing to walk you through the algorithm explain what inputs drive the model, how recent data is weighted against longer historical patterns, how external signals are incorporated tend to be the ones with something real to show.
What Skeptical Operators Should Demand
Before signing anything, any operator who has been through this before should ask for a proof-of-concept test using their own data. Not a demo with sample data. Their data.
Structure it simply: provide historical data up to a date you already have actuals for. Ask for a forecast of the following 30 to 60 days. Compare to actuals. Evaluate by SKU, not just total volume. Look at the pattern over time, not individual day accuracy.
If a vendor won’t do this, that’s a useful answer. If they will, the results will tell you more in 30 days than any sales presentation.
The skeptics who’ve been burned aren’t wrong about forecasting. They’re right that most of it doesn’t work well enough to justify the cost. What they’re sometimes wrong about is concluding that nothing does.
The bar for what good forecasting looks like exists. It requires real methodology, honest evaluation, and vendors who are willing to be tested. That’s a higher bar than most operators have been offered. It’s the right bar to hold.
Ready to run a real proof-of-concept test with your data? Let’s Talk


