


Every restaurant generates mountains of data. Sales reports, inventory logs, labor spreadsheets, waste tracking sheets. But there is a massive difference between knowing what happened last week and knowing exactly what your team should do tomorrow morning.
That difference comes down to three types of analytics: descriptive, predictive, and prescriptive. Most restaurant technology stops at the first two. Only prescriptive analytics closes the gap between information and action, giving operators the specific daily guidance they need to reduce waste, control labor costs, and run every shift with confidence.
ClearCOGS is the restaurant intelligence platform built on prescriptive AI. It integrates with your existing POS, inventory, and scheduling systems to transform the data you already have into simple daily playbooks for prep, ordering, and staffing. No rip and replace. No complex dashboards to interpret. Just clear answers delivered before the day begins.
To understand why that matters, it helps to see how all three types of analytics work in a real restaurant environment and where most operators get stuck.
What Is Descriptive Analytics?
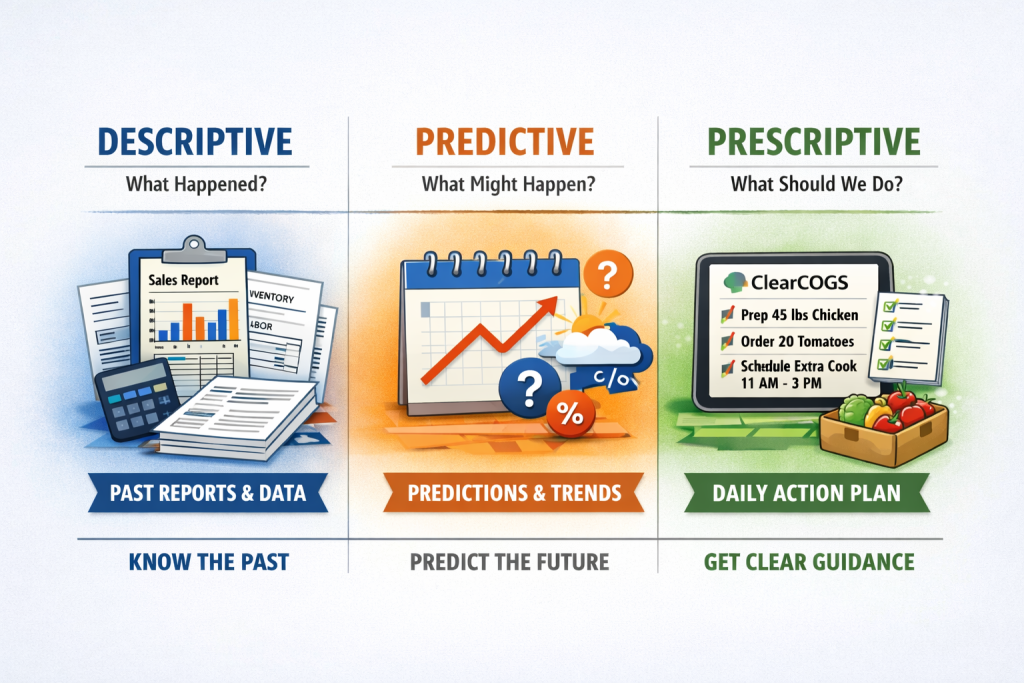
Descriptive analytics answers one question: What happened?
This is the rearview mirror of restaurant technology. It collects, organizes, and displays historical data so you can review past performance. If you have ever pulled an end-of-day sales report, checked your food cost percentage at the end of the month, or looked at a labor summary after a pay period closed, you have used descriptive analytics.
Restaurant Tools That Use Descriptive Analytics
- POS reporting dashboards (Toast, Square, Lightspeed) that show daily sales totals, item mix, peak hours, and average ticket size
- Inventory tracking platforms (MarketMan, BlueCart, Restaurant365) that log what was received, used, and wasted
- Labor management tools (7shifts, HotSchedules) that report hours worked, overtime, and labor cost percentages after the fact
- Accounting software (Restaurant365, Xtra Chef) that compiles P&L statements and cost summaries
What It Looks Like in Practice
Your Tuesday morning manager meeting starts with a stack of reports. Last week’s food cost came in at 34.2%. Labor ran high on Thursday because the closer stayed two hours past their scheduled shift. You had three waste incidents flagged in the walk-in.
All of that information is accurate. All of it arrived too late to change the outcome.
The Limitation
Descriptive analytics is a system of record. It captures history, but it requires a manager to interpret every data point and manually decide what to do about it. For a single location with a veteran operator, that process might work. For a multi-unit group trying to maintain consistency across ten or fifteen kitchens, it breaks down fast.
Key Takeaway: Descriptive analytics tells you what happened after it already happened. It is essential for tracking performance, but it cannot prevent the problems it reports.
What Is Predictive Analytics?
Predictive analytics answers a more forward-looking question: What is likely to happen?
Instead of only reporting that last Saturday was your busiest day in three weeks, predictive tools use historical patterns, seasonality, and sometimes external data to estimate what next Saturday might look like. This is where demand projections, sales trend modeling, and traffic pattern analysis come into play.
Restaurant Tools That Use Predictive Analytics
- Demand projection modules within platforms like Restaurant365 or CrunchTime that estimate future sales based on historical averages
- Scheduling tools that use past traffic patterns to suggest staffing levels for upcoming shifts
- POS platforms with basic sales trend features that project volume for the next week or month
- Standalone projection tools that model seasonal demand curves
What It Looks Like in Practice
Your scheduling software suggests that Saturday will be 20% busier than a normal weekend based on the last eight weeks of data. Your inventory platform projects higher chicken usage because the trend line has been climbing.
That is genuinely useful information. But now what?
Someone still has to sit down, translate that projection into a prep list, adjust the order guide, and modify the staffing plan. That “someone” is usually your most overloaded manager, working off a combination of the data, their gut instinct, and whatever they remember from last time.
The Limitation
A prediction without a plan is just a more educated guess. Think about it like a weather report. Knowing there is an 80% chance of rain tomorrow is helpful, but the weather report does not pack your umbrella, rearrange your patio seating, or switch your daily special. You still need someone to take action on the information.
For every location in a multi-unit operation, that interpretation step introduces inconsistency. Your strongest GM might nail it. Your newest manager might miss it entirely. The result is uneven execution across locations and margin that quietly leaks out through a thousand small daily decisions.
Key Takeaway: Predictive analytics tells you what might happen, but still depends on someone to figure out what to do about it. The gap between prediction and action is where most restaurants lose money.
What Is Prescriptive Analytics?
Prescriptive analytics answers the question that actually drives results: What should we do about it?
This is the leap that changes everything. Prescriptive analytics does not just estimate that tomorrow will be busy. It tells your prep team exactly how much to thaw, your ordering manager precisely what quantities to bring in, and your scheduler which positions need coverage and when. It takes the prediction and converts it into a specific, actionable daily plan with no interpretation required.
What It Looks Like in Practice
Your morning prep lead walks in at 6 AM and opens the ClearCOGS daily playbook. It says:
Prep 45 pounds of diced chicken (not 60 like last Tuesday) Hold off on prepping extra guacamole because projected demand is lower than the weekly average
Pull forward Thursday’s produce order by one day because a local event will spike weekend traffic
No spreadsheets. No gut calls. No digging through last week’s reports and hoping to spot the right pattern. The analysis already happened. The decision is already made. Your team just executes.
This is what it means to run your restaurant like you already have the answers to the test.
How ClearCOGS Delivers Prescriptive Analytics
ClearCOGS works as your restaurant’s system of decision, not just a system of record. Here is how the process works:
- Connect to your existing systems. ClearCOGS integrates with your POS, inventory, and scheduling platforms. No rip and replace required. Average onboarding takes about three weeks.
- AI analyzes your data continuously. Sales trends, weather patterns, local events, seasonal shifts, historical demand, and real-time inventory all feed into the prescriptive engine.
- Daily playbooks are generated for each location. Every morning, your team receives specific guidance on what to prep, what to order, and how to staff, tailored to that location’s unique demand patterns.
- Your team executes with confidence. The newest, least experienced manager can run a shift with the same precision as your ten-year veteran because the complex decision-making has already been done.
The Compounding Effect
One of the most powerful and underappreciated benefits of prescriptive analytics is how the results compound over time:
- When prep quantities are accurate, you waste less food
- When you waste less food, your ordering becomes more precise
- When ordering is tighter, your inventory stays leaner
- When inventory is leaner, your theoretical food cost actually matches reality
- When theoretical matches actual, you have true visibility into your margins
- Each improved decision feeds the next one. Over weeks and months, this compounding effect can be the difference between flat margins and meaningful profit growth.
Key Takeaway: Prescriptive analytics removes the interpretation gap entirely. It tells your team what to do, not just what might happen. That is the shift from reactive to proactive operations.
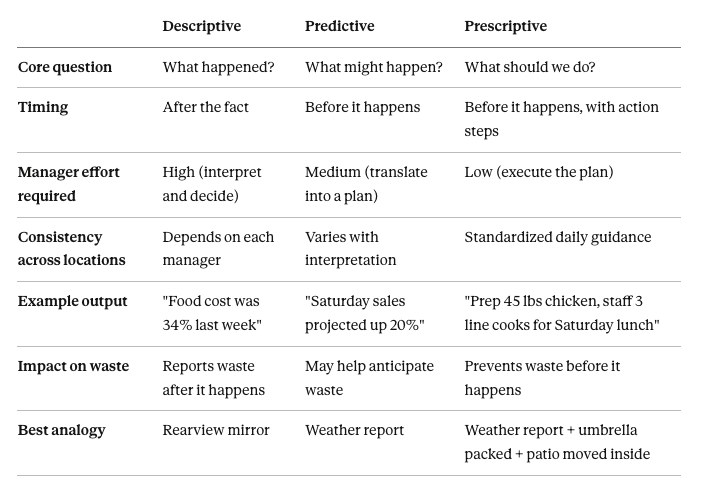
Side-by-Side Comparison: Descriptive vs. Predictive vs. Prescriptive Analytics
Why This Matters Right Now
Restaurants are still largely reactive. Teams scramble after problems show up. The next real shift is making operations proactive. Daily plans should anticipate demand, set pars before the day begins, and adjust early so rushes feel routine. Operators will judge technology by how consistently it prevents surprises, not by how elegantly it reports them.
Guest tolerance for inconsistency is declining. Labor is harder to find and more expensive to keep. Food costs remain volatile. In that environment, the operators who pull ahead are not the ones running better reports. They are the ones whose teams walk into every shift already knowing what the day requires.
The financial impact scales quickly. Consider a ten-unit restaurant group where each location loses a few hundred dollars a week to over-prepping and misallocated labor hours. That is tens of thousands of dollars every month in margin erosion that never shows up as a single dramatic failure. It just quietly bleeds out through small decisions made without the right information at the right time.
Descriptive analytics would show you that waste after the period closes
Predictive analytics might warn you it is coming
Prescriptive analytics prevents it from happening by giving your team the exact plan before the day starts
How to Evaluate Your Current Restaurant Technology
Not every tool that claims to use AI is actually prescriptive. Here is a quick checklist to evaluate where your tech stack falls:
Your tool is descriptive if it:
Shows dashboards and reports summarizing past performance
Requires managers to pull insights and decide what to do
Delivers information after the period or shift has ended
Focuses on “what happened” metrics
Your tool is predictive if it:
Projects future sales or demand based on historical data
Gives trend lines or estimated volumes for upcoming periods
Still requires someone to translate projections into daily action
Focuses on “what might happen” estimates
Your tool is prescriptive if it:
Delivers specific daily guidance on prep quantities, order amounts, and staffing levels
Accounts for weather, events, seasonality, and real-time inventory
Removes the need for managers to interpret data and build their own plans
Focuses on “what to do” with clear, actionable daily direction
If most of your checks land in the first two categories, your team is still doing the hardest part of the job manually: turning information into the right daily decisions.
Frequently Asked Questions
What is prescriptive analytics in simple terms? Prescriptive analytics goes beyond showing you data or projecting trends. It tells your team exactly what to do. In a restaurant context, that means specific daily guidance on how much to prep, what to order, and how to staff each shift, delivered before the day starts.
How is prescriptive analytics different from predictive analytics? Predictive analytics estimates what might happen (for example, projecting that Saturday will be 20% busier). Prescriptive analytics takes that projection and converts it into a specific action plan (for example, prep 45 pounds of chicken, schedule an extra line cook from 11 AM to 3 PM). Predictive gives you a number. Prescriptive gives you a plan.
Do I need to replace my current restaurant technology to use prescriptive analytics? No. ClearCOGS integrates with your existing POS, inventory, and scheduling systems. It works with the data you are already generating and layers prescriptive intelligence on top, turning your current tech stack into a more powerful decision-making engine without disruption.
Is prescriptive analytics only for large restaurant groups? Prescriptive analytics is especially valuable for multi-unit operators because it standardizes daily decision-making across locations regardless of manager experience. However, any restaurant looking to reduce waste, optimize labor, and remove guesswork from daily operations can benefit.
How quickly can a restaurant see results from prescriptive analytics? ClearCOGS typically onboards in about three weeks. Operators often see measurable improvements in food waste and labor efficiency within the first month as daily playbooks replace manual planning and guesswork.
What kind of results can prescriptive analytics deliver? Restaurants using ClearCOGS have seen an average 55% reduction in food waste and up to a 40% increase in profit margins. Results vary by operation, but the consistent theme is that removing guesswork from daily decisions leads to tighter operations and stronger margins.
ClearCOGS is the restaurant intelligence platform that transforms daily uncertainty into confident, data-driven action. Our prescriptive AI integrates with your existing systems to deliver precise daily guidance on prep, ordering, and staffing, helping multi-unit operators reduce waste, optimize labor, and scale profitably.
Learn More by booking time with one of our solutions experts below


